- You are here:
- Home »
- Today's Trades »
- SignalWatch – Signals of the Day – 3.27.17

SignalWatch – Signals of the Day – 3.27.17
Signals of the Day - March 27
Welcome one and welcome all to the very first post of SignalWatch 2.0! It has been a long time coming and we are very stoked that the site is off and running.
The indexes opened this morning with a resounding thud, gapping down before rebounding some before closing mixed. The Dow closed in the red for the 8th day in a row, losing .22% while the S&P closed down .10%. The Nasdaq erased its early losses to close up .20%. Many traders and investors are looking at the market with some trepidation, worried that the Trump Rally has screeched to a halt in wake of the failed repeal of Obamacare. But as we witnessed today, the bulls are not ready to submit to a correction yet so things could still get interesting.
We have three brand-new signals to look at this evening so let’s get to it.
![]()
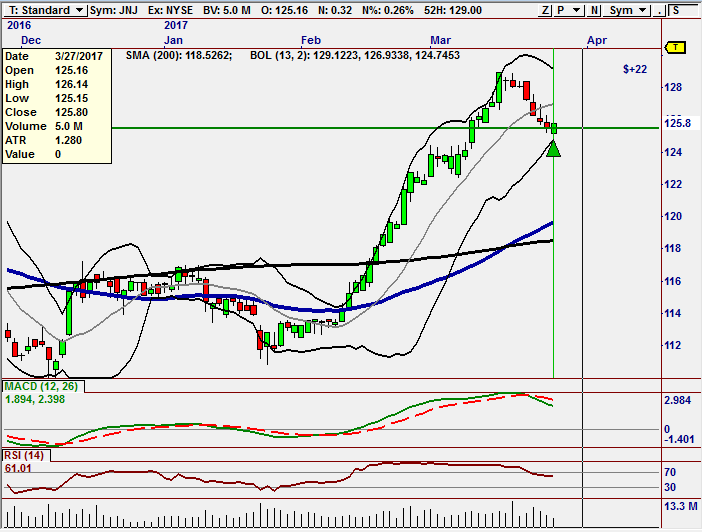
IT Strong Trend is looking at this support level as a new higher low.
JNJ enjoyed a raucous February and early March, climbing from the $112 all the way to the high $120’s before retreating from highs. But after over a week of pullbacks, JNJ is starting to get is trending mojo back. It is forming a new higher low along support close to $125.60, opening up a new price improved entry opportunity. As we can see with the Bollinger Band indicator, its is also oversold, putting it in prime position for a reversion move. Not only that, the 50 period Simple Moving Average (SMA) recently moved through the 200 SMA, offering further bullish confirmation.
The strategy that generated this signal belongs to our Intrinsic Trend Trading Module and is the IT Strong Trend Strategy. This strategy is mechanical and looks at recent moves in the market, and finds early indications of an emerging trend and an identifiable channel within the trend which price will likely move as the trend continues. IT Strong Trend the fires signal on pullback inside of those channels. Right now JNJ is at the bottom of the pullback in the channel, thus we have a brand new buy signal. If this trending move kicks back into gear, we could see it power up to challenge the $130 territory.
To learn more about IT Strong Trend, check out its PDF. Next up, Target.

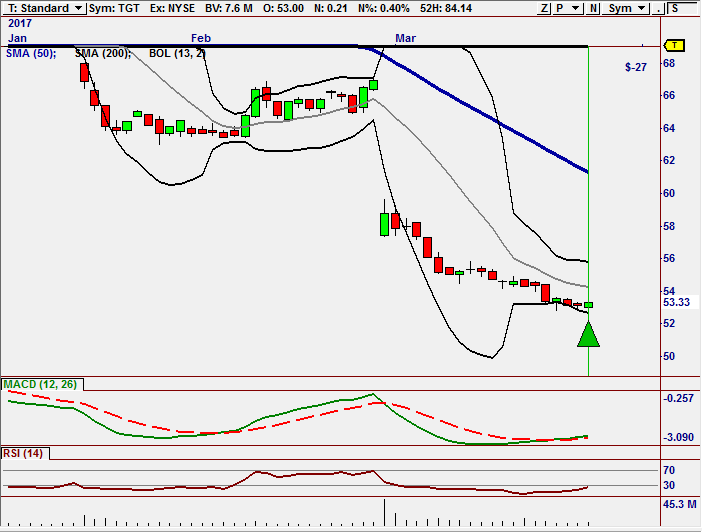
TGT could make an attempt to make a reversion move according to the Volume Power Strategy.
So Target has been beaten to a bloody pulp since January and has missed out on much of the post-election rally. TGT was crushed by poor sales numbers and many investors ran to the hills amongst the bad reports, causing TGT to fall into a free fall. It is now incredibly oversold on both the RSI indicator and the Bollinger Bands indicator. We are also now starting to see volume spike higher and the bullish MACD indicator crossover has recently occurred.
The Volume Power Strategy fired this signal and can be found in the Volume Systems 2.0 plug-in. Volume Power looks for volume flow, or excessive amounts of traders entering or exiting positions. So in a nutshell, the strategy is looking at the overall movement of money into and out of a stock. Volume Power also looks at the resulting imbalance between supply and demand as the volume flow moves from bullish to bearish and vice versa. That information combined with several indicators showing us that TGT is extremely oversold, makes this signal look intriguing. If we do see a reversion move, it may make a run at resistance at $59.00. To know more, check out VS2’s literature.

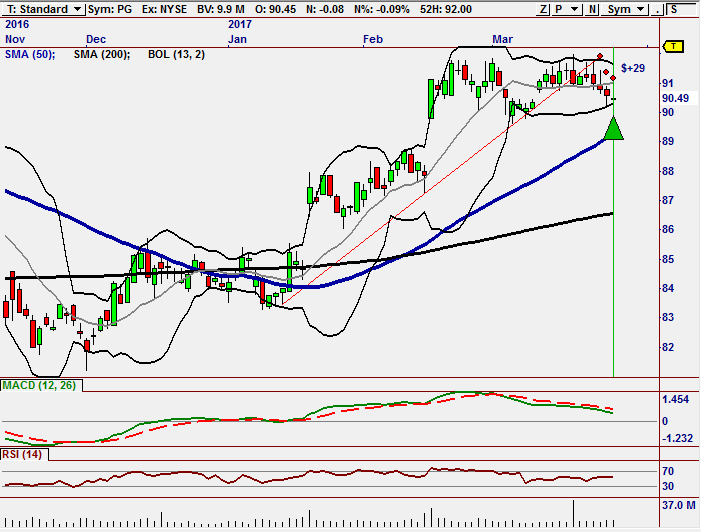
ARM5 RTM-17 is looking for a new reversion move on PG.
PG has enjoyed quite a run for most of 2017, setting newer higher highs and higher lows left and right. And now we are seeing it pull back and hit the breaks along support at $90.50. Volume is starting to push higher and PG is oversold on the Bollinger Bands. This signal is fired by our newest and most advanced piece of A.I., ARM5 RTM-17. The strategy is comprised of three different A.I. components; the Genetic Algorithm, the Neural Network, and the Consensus Block. What ARM5 RTM-17 is looking for is large pullbacks in very steady, long-term trends. PG fits the bill for a long, steady trend. ARM5 RTM-17 also compares short-term price movement to the longer, over-arching trend, looking for new opportunities. It also recognizes opportunities in flat or sideways markets. To learn more about ARM5 RTM-17, take a look at this.
If ARM5 RTM-17 is on to something, we might see a push into the mid $90’s.
That’s it for this evening’s signals. Come right on back here tomorrow for more great signals and information. Have a wonderful evening and happy trading.
![]()
The products and demonstrations listed on this website are not recommendations to buy or sell, but rather guidelines to interpreting their respective analysis methods. This information should only be used by investors who are aware of the risks inherent in trading. Nirvana Systems shall have no liability for any investment decisions based on the use of their software, any trading strategies or any information provided through other services such as seminars, webinars, or content included in the SignalWatch website.