- You are here:
- Home »
- Today's Trades »
- SignalWatch Daily Signal Picks – 3.15.17

SignalWatch Daily Signal Picks – 3.15.17
Signals of the Day
What a day we had in the market. The Fed announced that it is looking to raise the interests rates twice throughout the course of 2017. The Fed has been hinting at rate hikes for a while now in an attempt not to send any shockwaves through the market. The announcement was met with a full on rally, as investors and traders took the rate hike as confirmation on the strength of the economy. Keeping in line with the market, we are going to look at some of the best buying prospects out there this afternoon.

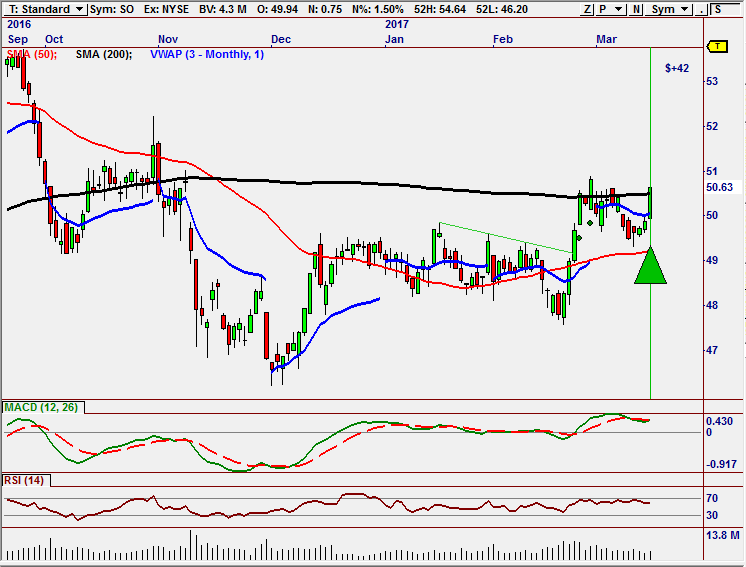
A new breakout opportunity has opened up on SO after pushing through the 200 SMA.
SO pivoted off of support last month and ran for three sessions in a beautiful snapback reversal. The reversal halted after coming into contact with 200 SMA at $50.60. It then consolidated for a few session before pulled back and found support once again $49.60 before pivoting to the upside yet again.
We can see that SO is now poised to make a breakout move to try and breakthrough both resistance and the 200 SMA at $50.50. Volume is increasing, signaling a new surge of buyers, the MACD trigger/indicator bullish crossover is on the verge of completing and there is still some room in the RSI for more upward movement before becoming overbought. If we do see SO make good on this breakout setup, we could see it in the $51.60 – $52.00 zone sooner rather than later.
This signal was generated the GT Volatility Breakout Strategy which can be found in our GroupTrader 3.0 plugin-in. GroupTrader focuses on Industry Group Rotations. Group Rotations are usually led by fundamentals. For example, analyst project an increase in global energy consumption could signal the potential for higher oil prices in the near future. As a result, institutions begin buying Oil Services, Drillers, and others related to the oil industry. The public sees the prices of these stocks increasing so they dogpile on and buy too. This often times leads to buying frenzies and breakouts.
To find these moves, we built a correlation feature that measures how well individual stocks follow the group. A multi-chart was added to display the feature to make it easy to review and confirm candidates. Group Trading Strategies and special Profiles that are configured to identify candidates in the short, medium, and long-term round out the package. To learn more about GroupTrader check out its PDF.

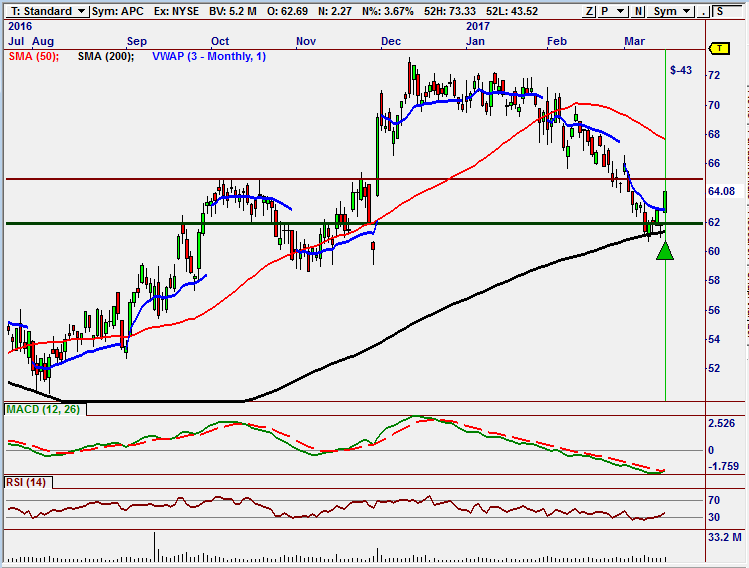
A new swing in momentum has APC looking for a bullish reversal.
Not only did the oil industry rally along with the rest of the market, it also got an added push with a solid Oil Inventories report. This helped push Anadarko up for the day and close out with a 3.67% gain! Along with the fundamental information that fueled this push, there are some strong technical indicators as well.
We see that APC tested support at $62 after a prolonged period of bearishness and pivoted hard to the upside. The support level was also a confluence level of the 200 SMA and support. Next, it went right through monthly VWAP and the bullish crossover on the MACD indicator also occurred. To top things off, APC is very oversold on the RSI indicator.
If things continue to move higher, we could see APC hanging out at the 50 SMA at $68 heading into April. Keep an eye out for additional entries on pullbacks as the move winds higher. This signal was also generated by GroupTrader 3.
To round out this afternoon’s signals we have a trending signal on MSFT.
![]()
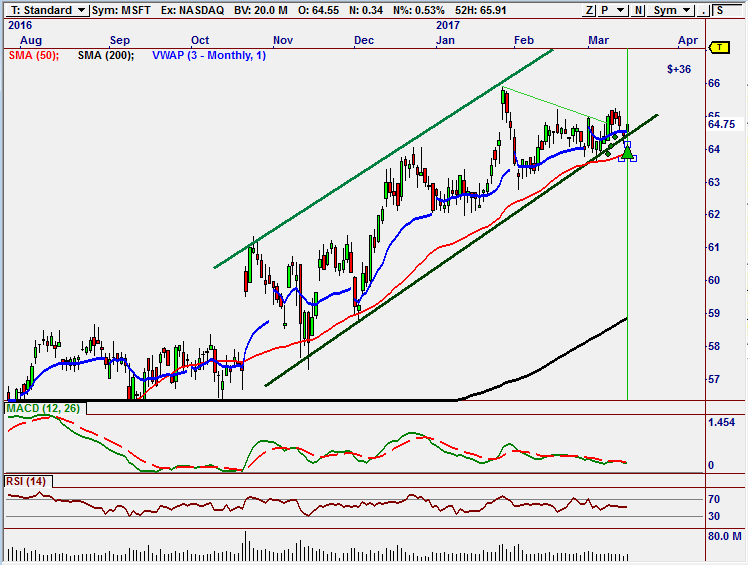
MSFT is pivoting off of the bottom boundary of the channel it has been trading in since last October.
As we can see MSFT has been winding higher while it has been trading in a beautiful channel that it started last October. It has fomed a new higher low on the monthly VWAP indicator just above the 50 SMA. Volume is also on the rise and the MACD and RSI indicators are both in bullish territory.
The strategy that fired this signal is one of our most advanced strategy, MS-16. MS-16 uses two different momentum based systems and filters based on trend direction to get solid returns. The MS-16 Strategy also uses an indicator in OmniTrader called Days to Earnings. This indicator helps to avoid trading into a potentially dangerous earnings report. The MS-16 Strategy with the MS-16 Dynamic Scan pinpoints the stocks that are outperforming the market but have made a significant pullback against the trend.
As we can see, MSFT fits the bill for everything MS-16 is looking for. If things continue as predicted, we may see MSFT make its way back up into the high $60’s heading into further into spring.
Good luck trading tomorrow and don’t forget to check back here for new signals.
Past performance is no guarantee of future results. Inherent in any investment is the potential for loss. This material is being provided for informational purposes only and nothing herein constitutes investment, legal, accounting or tax advice, or a recommendation to buy, sell or hold a security. No recommendation or advice is being given as to whether any investment is suitable for a particular investor. It should not be assumed that any investments in securities, companies, sectors or markets identified and described were or will be profitable.
About the Author Ryan Belknap
Ryan has been with Nirvana since 2012 and has been manning the trading desk since Day 1. He was one of the founding members of Nirvana's Trading Lab and also TraderSource.com along with Ryan Olson and Russell Casperson. Ryan logged more than 3,500 hours trading and educating live in the Lab. He is also the lead author of SignalWatch.com. Ryan is a seasoned educator and has conducted numerous educational webinars and is an OmniTrader University instructor. Ryan prefers swing trading and position trading. Outside of the market, Ryan has passions for the outdoors, baseball, exercise, coffee, pop-culture and spending time with his family.