- You are here:
- Home »
- Today's Trades »
- SignalWatch – 5.25.17

SignalWatch – 5.25.17
May 25th
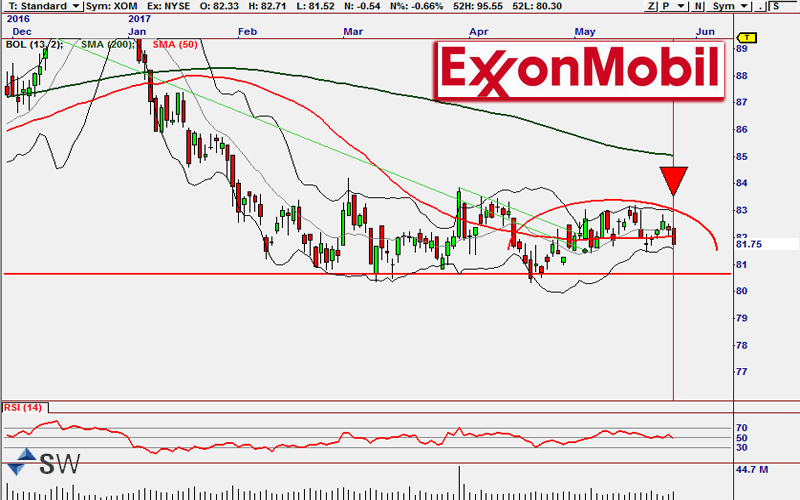
XOM has started to form a nice bearish saucer pattern and may be on its way to test support below $81.00.
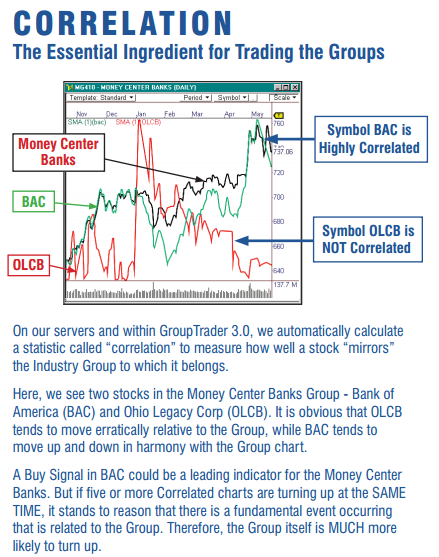
Basic concept behind correlation.
The entire oil industry got roughed up during today’s session and XOM was no exception. On its way to losing .66%, it moved below the 50 period moving average and continued to form a bearish saucer pattern. A bearish saucer is a chart pattern that indicates that a stock’s price has reached its high and that the upward trend has terminated. You’ll typically see stocks return to former levels of support once the saucer has completed and in some cases, saucers can lead to large breakout moves. It should also be noted that we are seeing a spike in volume at the moment so we could be in for some additional volatility. The entire oil industry moved down today and has been on shaky ground after OPEC’s latest statements and actions. We very well could see a rebound in crude and the industry as a whole, but this chart looks like it is heading on down to test support below $81.
This signal was brought to you by your friendly, neighborhood GroupTrader Medium Term strategy. This strategy is part of our GroupTrader 3 plug-in, which has been featured heavily on SW as of late. So to keep it simple, GroupTrader seeks out the highest correlated industry groups in the market that are poised to make a move. It then finds the best candidates within these groups and confirms the signal with the composite group chart. By doing this, you gain an extraordinary amount of confirmation and momentum in a trade. This also works for ETF’s if that’s your trading instrument of choice. To learn the nitty-gritty on GT3, check out its literature here. Next up, another energy stock, OXY.
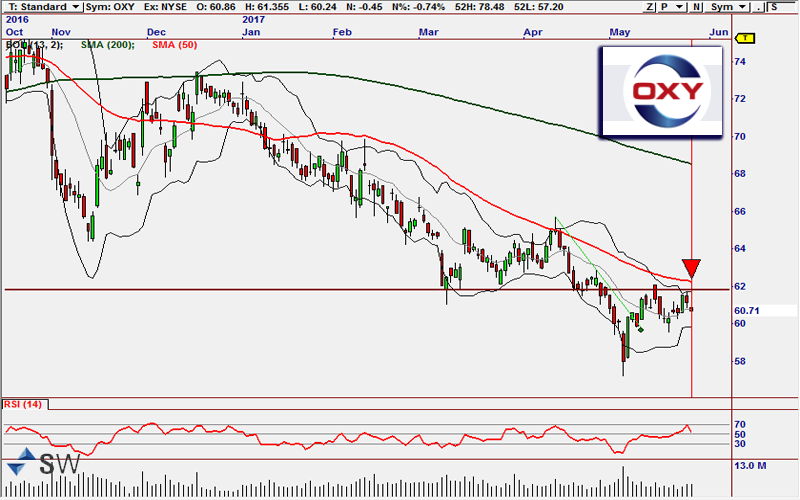
OXY has formed a double top reversal pattern and may be on its way back into the high $50’s.
One more GroupTrader signal for the road! OXY has much of the same chart features that we saw on XOM above, but instead of a saucer pattern, we are looking at a double top reversal pattern here. A double top forms when the it drops after the rise of a stock, then rises back to the prior high and then drops again. These are great setups and usually lead to highly confirmed reversals. An easy way to remember what a double top looks like is the letter M. If you can see an M forming in the chart, like we do here, you’ve found yourself a double top. Nice. Many times double tops will push stock’s price back down to their previous support levels, which in this case lies right around $58.
Yes, I know, another GroupTrader signal. Some might be saying, “holy cow Ryan, pick another strategy”, but I would counter those folks by saying that the plug-in is just on fire right now finding good moves. And not just a little bit on fire, I’m talking NBA Jam on fire folks. Boom shakalaka as they say. I’m going to spare myself from sounding like a broken record so I won’t repeat how GT3 works here. If you passed up on looking at its literature last signal, might want to check it out now. Here’s that link once again so you don’t have to scroll up!
And the last signal for this week is on Phillip Morris, an Altria company.
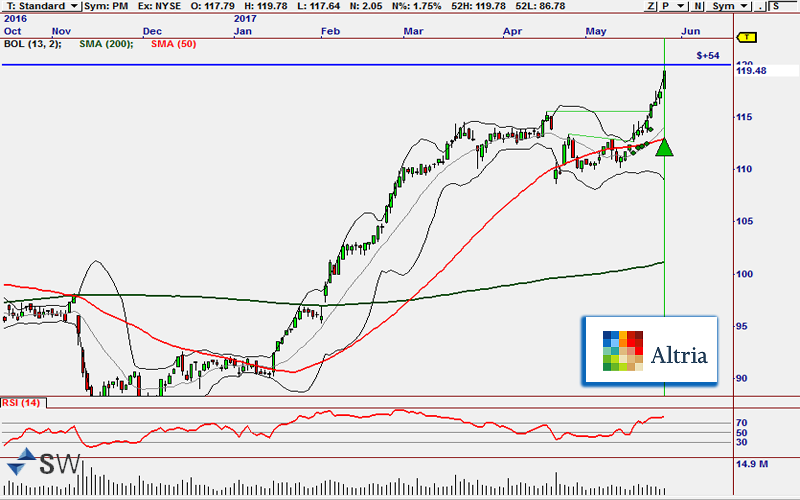
Smoking might be bad for you, but right now, PM is smoking hot.
Look at the meteoric rise PM has enjoyed over the course of 2017. From $90 to almost $120! Holy smokes, that’s a 33% gain! Sorry… I couldn’t resist the awful pun. But, it looks like we might see even more out of PM before this rally is all said and done. It is on its way to test resistance at $120 and if it can move above that, a breakout move may commence. Resistance is a price level where a security’s price stops rising and moves sideways or downward. Resistance levels indicate an abundance of supply. Because of its over-supply, the stock may have difficulty rising above this level and pullback. BUT… if a stock can push through that level and hold, buying frenzies are not uncommon as folks flood into the stock.
Now, it should be noted that it would not be unusual, and even might be helpful, to see PM pullback after testing resistance. This will occur because you will have traders closing out positions at highs, causing price to drop, and then you’ll also have some bearish scalpers looking to make a quick buck by placing a quick short position. Once everything balances out though, a new higher low will form and this move will be back in business. Just something to watch for.
This signal was fired by our base OmniTrader 2017 Breakout strategy. With all of our very advanced strategies, it is easy to forget the base strategies in OT and how good they are. This strategy measures large changes in ATR, momentum and changes in volume, along with a few other things sprinkled in. And like we have said before, if you haven’t used OT yet, you can get yourself a 30 day trial for a low, low price of $0 right here.
So that is going to wrap us up for the week. The next post will hit the street next Monday night, seeing as we have a long weekend ahead of us. I hope you all have a safe and wonderful weekend and we will see you back here Monday. Until then!

The products and demonstrations listed on this website are not recommendations to buy or sell, but rather guidelines to interpreting their respective analysis methods. This information should only be used by investors who are aware of the risks inherent in trading. Nirvana Systems shall have no liability for any investment decisions based on the use of their software, any trading strategies or any information provided through other services such as seminars, webinars, or content included in the SignalWatch website.
About the Author Ryan Belknap
Ryan has been with Nirvana since 2012 and has been manning the trading desk since Day 1. He was one of the founding members of Nirvana's Trading Lab and also TraderSource.com along with Ryan Olson and Russell Casperson. Ryan logged more than 3,500 hours trading and educating live in the Lab. He is also the lead author of SignalWatch.com. Ryan is a seasoned educator and has conducted numerous educational webinars and is an OmniTrader University instructor. Ryan prefers swing trading and position trading. Outside of the market, Ryan has passions for the outdoors, baseball, exercise, coffee, pop-culture and spending time with his family.