- You are here:
- Home »
- Today's Trades »
- SignalWatch – 5.17.17

SignalWatch – 5.17.17
May 17th
Mayday, mayday, the market got thumped today. The indexes took a major turn to the downside today, logging their biggest losses this year in wake of the new scandals that the Trump Administration finds itself in. As more details trickled out today concerning the Comey Memo, the market continued to slide on down. This story looks like it may have more staying power than the previous issues Trump has faced, so more uncertainty and volatility may be in the cards in the coming days. The bulls won’t go down without a fight though, so keep your heads on a swivel.
As for today’s signals we are going to go a little outside of the box and look at three sell signals. Now we are well aware that many folks only like to take long positions, but, what better day to showcase our sell signals then a day when the market took a swan dive? So let’s get to the signals.
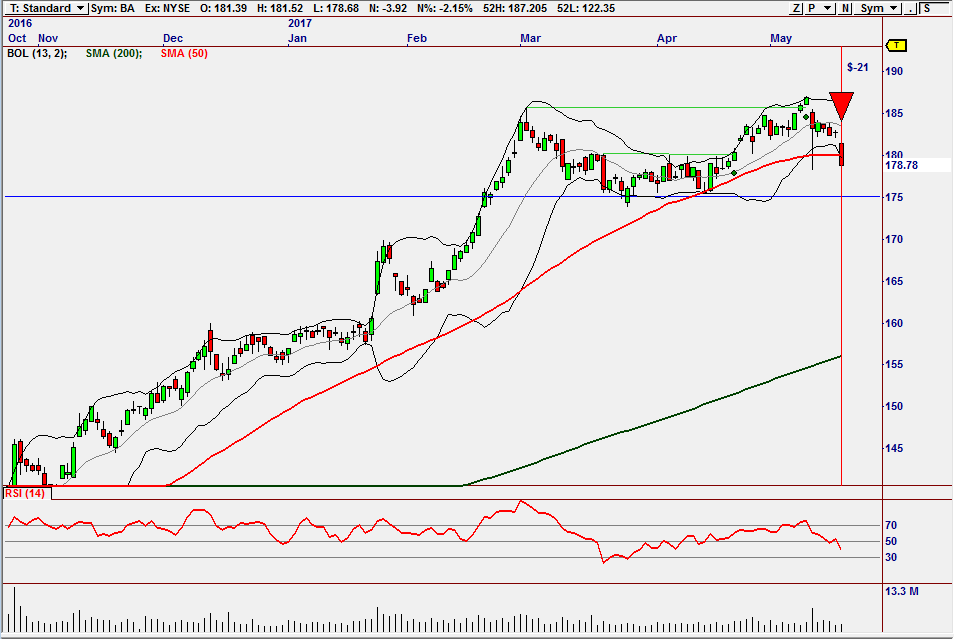
CPRM6 is looking for a trendline break to the downside on BA.
Like the vast majority of the market, BA took a big hit today, losing 2.15% once the dust this afternoon. BA has been in a strong trend for months but moved below the 50 SMA for the first time since last September this afternoon. Whenever a stock moves through a major moving average like the 50, it should be taken note of. The 50 SMA was also serving as support which gives adds another layer of confirmation to the move. If this downhill move continues, look for it to test support at $175 next and if that level is broken, things could slide as far as $170 by early summer.
This signal was fired by our Chart Pattern Recognition 6 module, which is one of our most trusted plug-ins to date. Folks have been trading chart patterns for decades and CPRM6 gives this highly succesful method a big boost with automation. CPRM6 uses hundreds of systems and filters to identify over 200 variations of chart patterns. CPRM6 even filters the signals through multiple time-frames to insure that the signals will hold up in any condition. Keep an eye on this one, things could get interesting. Next up, Comcast.
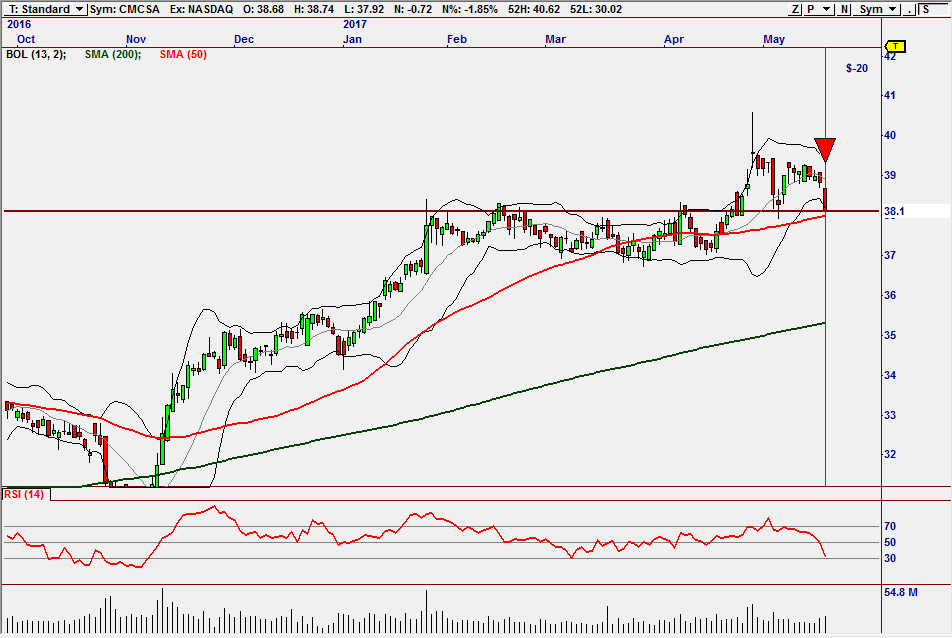
GroupTrader is calling a drop for CMCSA.
Comcast got roughed up today, losing 1.85% by the day’s end. CMCSA is now bearing down on support at $38.10, which is also a confluence level with the 50 SMA, making it a critical level. If support is broken, CMCSA could slide on down into the $37 zone. Volume is spiking so we may see some additional volatility come into play, but CMCSA’s momentum definitely has a bearish feel to it. Like many of our signals from this week, this one belongs to the GroupTrader 3 plug-in. GroupTrader looks for the most highly correlated industry groups in the market and then finds the most likely symbols to move within those groups. Since we have covered GroupTrader pretty extensively this week I won’t go into great detail here but if you’re interested in all of the minutiae of GroupTrader, check out its literature here.
Last but not least, OXY.
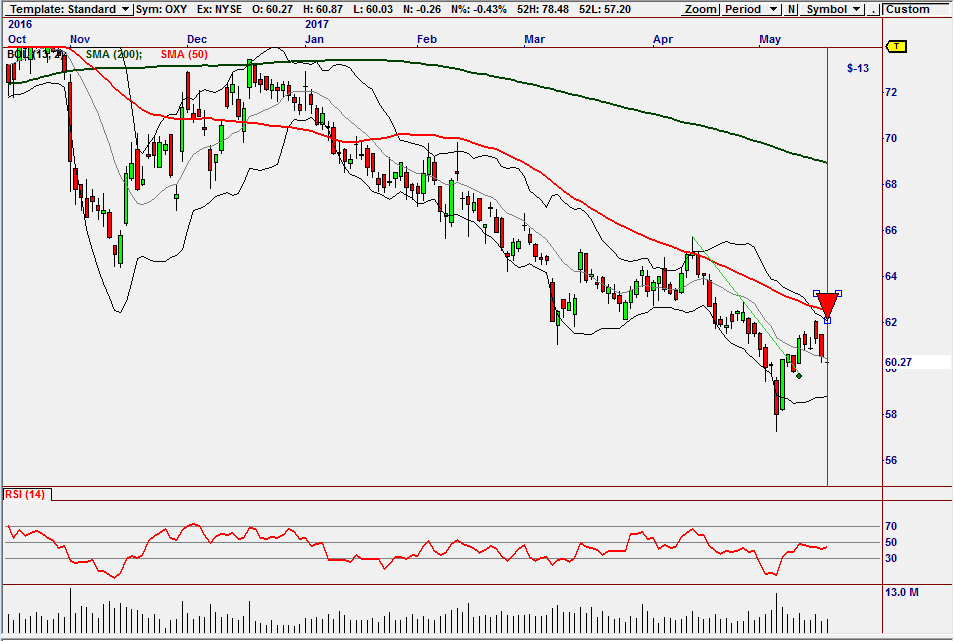
Volume Systems is looking for renewed bearishness on OXY.
OXY has been in a steady decline since last September, setting up many consecutive lower highs followed by lower lows. This is exactly where we find OXY now, setting up a new lower high along the 50 SMA which is also serving as resistance at $62. And like the strategy hints at, we are seeing an increase in volume, which could be signalling the beginning of the move. Volume Systems 2.0 is a series of indicators and systems based on Volume Flow. Volume Flow detects professional accumulation and distribution. To see the Volume Flow, we created an indicator called Volume Heat which visualizes the movement of money into and out of a stock. With Volume Flow, you can also see the resulting supply and demand imbalance as the flow goes from bullish to bearish and vice versa. To learn more about what makes Volume Systems tick, check it out here.
That’s it for tonight. Make sure to buckle your seat-belt tomorrow, it looks like it could be a wild and woolly day in the market. Have a wonderful night.
The products and demonstrations listed on this website are not recommendations to buy or sell, but rather guidelines to interpreting their respective analysis methods. This information should only be used by investors who are aware of the risks inherent in trading. Nirvana Systems shall have no liability for any investment decisions based on the use of their software, any trading strategies or any information provided through other services such as seminars, webinars, or content included in the SignalWatch website.
About the Author Ryan Belknap
Ryan has been with Nirvana since 2012 and has been manning the trading desk since Day 1. He was one of the founding members of Nirvana's Trading Lab and also TraderSource.com along with Ryan Olson and Russell Casperson. Ryan logged more than 3,500 hours trading and educating live in the Lab. He is also the lead author of SignalWatch.com. Ryan is a seasoned educator and has conducted numerous educational webinars and is an OmniTrader University instructor. Ryan prefers swing trading and position trading. Outside of the market, Ryan has passions for the outdoors, baseball, exercise, coffee, pop-culture and spending time with his family.