- You are here:
- Home »
- Today's Trades »
- SignalWatch – 4.26.17

SignalWatch – 4.26.17
April 26th
Afternoon everybody. Great to see you. After a few days of exuberance, that market pulled back a bit, but that is not uncommon so not a reason to worry. The Dow closed down .10%, the S&P -.05% and the Nasdaq broke even percentage wise after reaching new all-time highs yesterday.
Tonight we are featuring two buy signals and one sell signal so let’s get to it.
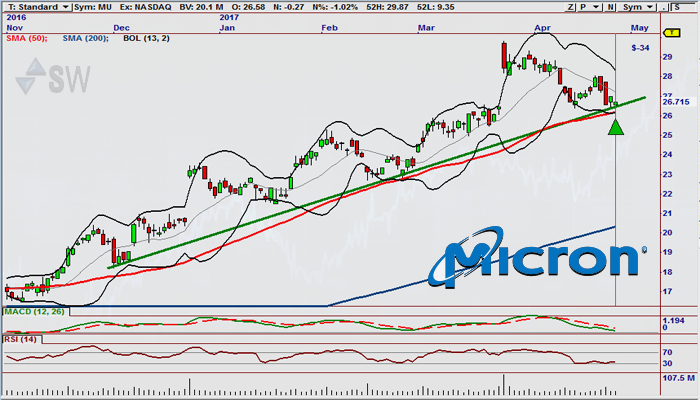
MU has set itself up for a brand-new higher low.
Intrinsic Trend Trading Module
MU has been rocking and rolling since the rally kicked off after the election last November. It has been moving higher in an extremely steady trend which has featured numerous higher highs and higher lows. And it looks like we are getting another setup that could lead to a new higher low now. There are three major indicators that look ultra-promising. One is that it is currently sitting along support at $26.50, another is that it is oversold on both the RSI and Bollinger Band indicators. These indicators give us a good bit of technical confirmation that a bounce could be coming. Not to mention it is sitting on the pivot level for the trend itself. If this move pops, we could see it run into the $29-$30 zone.
This signal was fired by our Intrinsic Trend Trading Module. What ITM does is closely examine recent moves in the market, and finds early and emerging trends as well as channels within those trends. The goal is to enter trades on pullbacks within the found channel. ITM also uses indicators that measure Trend Strength and Trend Quality. Right now MU qualifies for all of the above and the price is on the current channel. If you’d like to know more check out the PDF.
Next up, J.B. Hunt.
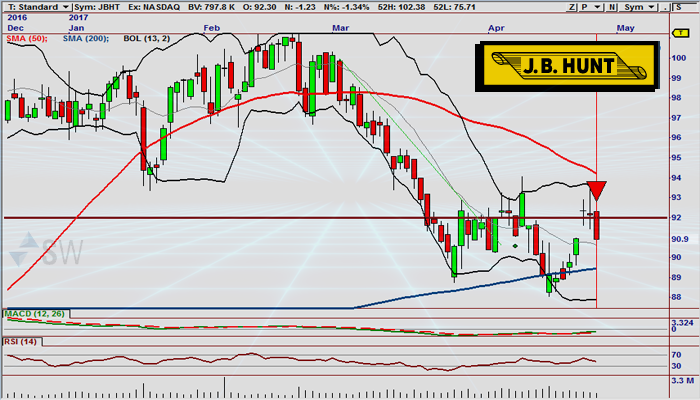
JBHT has pivoted to the downside after testing resistance.
After testing resistance at $92.40, JBHT pivoted back to the downside and dropped 1.34% during today’s session. JBHT has been moving down steadily since early March and has moved even lower after reporting poor earnings. JBHT now looks like it is now forming a trading range, with the upper boundary  at resistance and the lower boundary at $89.00. If this bearish move keeps on heading lower, it is likely to test the lower range boundary.
The strategy that fired this signal is the Secret Sauce 2. The Sauce is based on relative momentum. If you find stocks that are stronger than the broad market, those are likely to be the stocks that are being bought. Once we know which stocks are hot, it’s easy to apply good Reversal or Breakout Signals for high-percentage trades. Relative momentum is the system that finds these moves. This indicator identifies the symbols that are taking off relative to the market. By measuring momentum, we can know exactly which symbols are being accumulated, and which are generally being sold off. And in this case, it looks like JBHT is being sold off.
The last signal for the night is a breakout signal on PAYX.

A great saucer pattern has formed on PAYX.
Saucers are one of my absolute favorite chart patterns. And here on PAYX, we’ve got a great one. Not only do we see that nice rounde d bottom, it has also just moved through the lid level at $59.50, which is also resistance. Saucers are charts patterns that indicate that a stock’s price has reached its low and that the bearish trend has come to an end. It will test another level of resistance at $60.50 which is the 50 SMA.
The Chart Pattern Recognition Module 6 (CPRM6) automatically find stocks with the strongest patterns in the entire market. It finds over 200 patterns in EOD timeframes all the way down to real-time minute charts. CPRM6 finds the historical and current patterns. This allows us to find the best setups based on the current timeframe analysis. In this case, the daily timeframe.
That’s it for tonight folks. Don’t forget if you have not scored your OmniTrader yet, you can do so for free. Make sure to take advantage of the trial just for being an SW member. Check it out!
Have a wonderful night and we’ll catch you guys tomorrow!
![]()
The products and demonstrations listed on this website are not recommendations to buy or sell, but rather guidelines to interpreting their respective analysis methods. This information should only be used by investors who are aware of the risks inherent in trading. Nirvana Systems shall have no liability for any investment decisions based on the use of their software, any trading strategies or any information provided through other services such as seminars, webinars, or content included in the SignalWatch website.

About the Author Ryan Belknap
Ryan has been with Nirvana since 2012 and has been manning the trading desk since Day 1. He was one of the founding members of Nirvana's Trading Lab and also TraderSource.com along with Ryan Olson and Russell Casperson. Ryan logged more than 3,500 hours trading and educating live in the Lab. He is also the lead author of SignalWatch.com. Ryan is a seasoned educator and has conducted numerous educational webinars and is an OmniTrader University instructor. Ryan prefers swing trading and position trading. Outside of the market, Ryan has passions for the outdoors, baseball, exercise, coffee, pop-culture and spending time with his family.