- You are here:
- Home »
- Today's Trades »
- Signals of the Day – March 29th

Signals of the Day – March 29th
Signals of the Day - 3.29.17
Good evening folks. The day ended up mixed with the S&P and the Nasdaq closing up for the day while the Dow took a slight turn to the downside after rebounding yesterday. Crude picked up a bit today after a solid inventory report while gold slid a bit to the downside.
Let’s cut to the chase and dive headlong into this evening’s signals. First up, Medtronic.
![]()

Hurst Cycle Trader is looking for a new bullish cycle to being on MDT.
MDT has had a heck of a run since early January but it has pulled back after running smack dab into resistance at $84 earlier this month. But, things look like MDT might get a tad bit interesting in the coming sessions. For the past several sessions it had been consolidating along support at $80.75 but over the last two sessions, we have seen an increase in volume, which is a precursor to new buying cycles. It is oversold on both the RSI and the Bollinger Band indicators which put MDT in solid buying territory. One thing to note, though, is it is about to test the 200 Simple Moving Average at $82 which will act as a bit of resistance. If MDT strolls right on through the 200 without any hesitation, the new bullish cycle could be on.
This signal was generated by the Hurst Cycle Trader strategy which is found in the, you guessed it, Hurst Cycle Trader plug-in. This strategy is based on the work of J.M Hurst, author of The Profit Magic of Stock Transaction Timing. His book is a solid read. But, the back to the strategy… Hurst’s method is based around drawing “envelopes” around price action to predict the next cycle low. After the cycle low is identified, we start to see the shorter term and the medium term cycles turning up, provided the price follows the envelope pattern. By discovering these cycle lows or highs, one is able to see entry zones where a given stock’s price should explosively move in the direction of a new trend.
But, that’s only step one. Step two is to arrive at the most precise entry possible, Hurst used valid trend lines. When the valid trend lines are broken, buy or sell orders are made. Hurst also used specialized trailing stops based on levels that take advantage of the natural market cycles. So yes, that is a lot. But, since we really like Hurst’s work, we automated the process in OmniTrader, because automation is our gig. We automated the process by projecting the envelope through an application of regression analysis. I could continue down this path but, we have an excellent PDF authored by Ed that is also worth a read. Check it out here. If Hurst gets this one right, we could see a pop back into the $84 zone.
Moving on… a reversal signal on Halliburton!
![]()
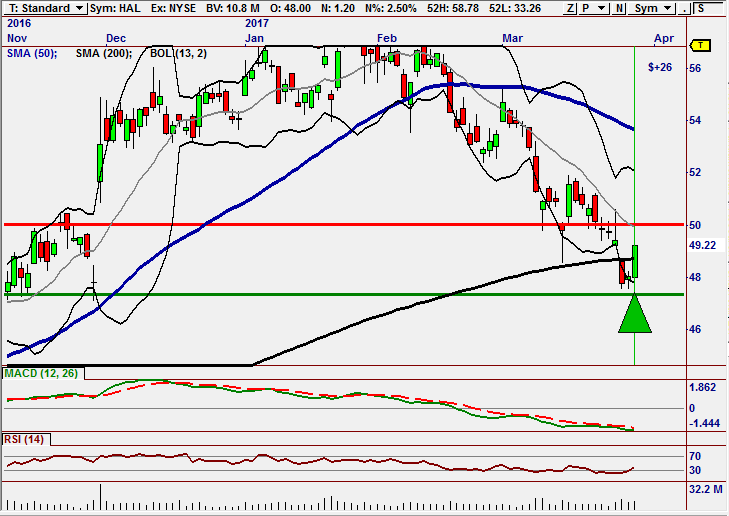
HAL looks like it could pull off a powerful snapback reversal and GT Momentum agrees.
HAL looks is ripe for a potential bullish reversal. After a strong end to 2016 and a decent start to ’17, HAL has been moving lower since February. But, after months of decline, it has hit the breaks along the 200 SMA. Now there is always the potential for this to be a quick bounce and form a lower high, but there are some interesting qualities about this particular setup. First, almost all traders use major moving averages as indicators and buy and sell stocks that are testing these important levels. It is not uncommon at all to see major reversals or pivots made along moving averages. Secondly, it is extremely oversold. When a stock gets as oversold as HAL is, it is not uncommon to see a snapback reversal. What is a snapback? Good question. Imagine a rubber band. Now pull that rubber band back towards you like you are going to shoot it at you buddy back in school. When you release the rubber band it violently “snaps back” and moves in the opposite way at a high velocity. And hopefully, you hit your target.
What is a snapback? Good question. Imagine a rubber band. Now pull that rubber band back towards you like you are going to shoot it at you buddy back in school. When you release the rubber band it violently “snaps back” and moves in the opposite way at a high velocity. And hopefully, you hit your target. Nonsequitur here, but, if ever presented with a chance to have a rubber band showdown with Ryan Olson, the answer is always no. Olson spent way too much time honing that particular skill.
So, we have a potential snapback setup, and we have some momentum according to our strategy, the GT Momentum strategy. This strategy belongs to our GroupTrader 3 (GT3) plug-in and is one of my favorite plug-ins. GT3 looks for stocks that are highly correlated in industry groups that are rotating together, or that are in an industry group rotation. Group rotation occurs when traders apply buying or selling pressure in any given group, in HAL’S case the oil group. and pushes prices of the group higher or lower relative to the market. Any industry can outperform or underperform the market, and the majority of stocks in a group usually participate in the rotation. Which makes the job of trading them that much easier.
Industry group rotations are almost always led by fundamental factors. In HAL’s case, increased oil projections could hint at the possibility of higher oil prices in the near future. As a result, folks start to accumulate shares of companies in the oil sector like oil services, drillers, and yadda yadda yadda. Individual traders then see those stock’s prices start to pop, so they hurry up and buy some too, and it just keeps on going until a buying frenzy is on.
We like taking advantage of buying frenzies so we made a correlation feature that measures how an individual stocks follow their respective industry. Then we threw in a multi-chart display capability and it was easy to confirm IGR. And after today’s solid oil numbers, you guessed it, the oil industry groups are moving on up. To sum it all up, if GT Momentum gets this one right and we see a snapback, we could see a quick snap into the $52 zone.
Let’s wrap this evening up with one more reversal signal, and one on IBM to be precise.
![]()

iTLB likes IBM for a reversal.
Ok, so we covered a lot tonight about reversal moves this evening, so I won’t bore you with more basics of a reversal setup. To be quick, IBM is consolidating along support and is also oversold on several indicators. Thus, technically interesting as a reversal setup. Now, the strategy, TLB Reversal, found in our iTLB 3.0 plugin, is looking for the best of the best in terms of reversal opportunities. It does this by applying the iTLB concept to several oscillators, including RSI, Stochastics, Momentum, and a few others for good measure. This system can then identify the best reversal opportunities. iTLB also applies the iTLB system to moving averages, which we mentioned the importance of earlier. If you are interested in learning more about what makes iTLB tick, feel free to peruse its literature here.
If this reversal takes off for us, we may see it bounce into the $180 zone sooner rather than later.
That does it for our signals for this evening. Have a wonderful night and happy trading tomorrow.
![]()
“If saving money is wrong, I don’t want to be right!” – William Shatner
The products and demonstrations listed on this website are not recommendations to buy or sell, but rather guidelines to interpreting their respective analysis methods. This information should only be used by investors who are aware of the risks inherent in trading. Nirvana Systems shall have no liability for any investment decisions based on the use of their software, any trading strategies or any information provided through other services such as seminars, webinars, or content included in the SignalWatch website.