- You are here:
- Home »
- Today's Trades »
- Signals of the Day – July 6

Signals of the Day – July 6
7-6-2017
The market went downhill today, with all three major indexes closing down for the day. The Nasdaq lost 1%, the Dow, -.74% and the S&P 500 -.94%. Crude managed to climb higher though, finishing with almost .5% gain. As for the signals, we are going to look at three new sell signals. There were several new buy signals, but the setups didn’t quite fit in with the SW standards. So, let’s take a look at T, M and LEN.
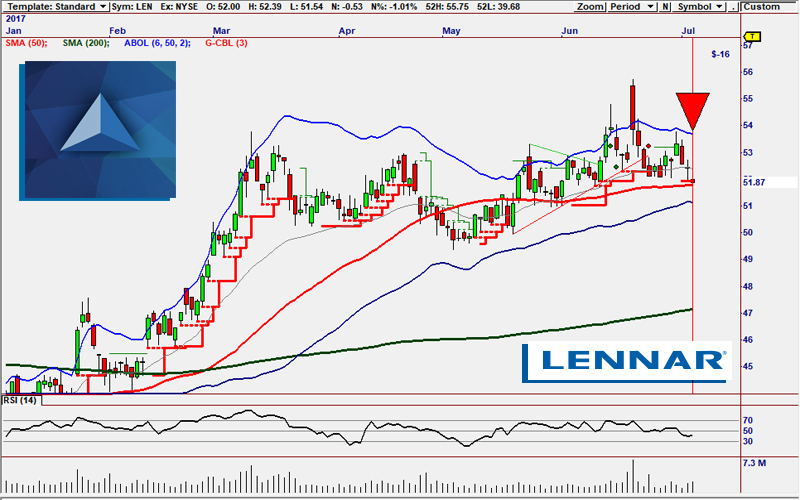
LEN looks as if it is ready to make a a break for lower prices.
LEN took a 1$ loss today and generated a new short signal in the process. We can see that it is testing the 50 SMA, and if that level is broken, things could get very interesting. Volume is on the rise and it has LEN has moved through the lower CBL. If LEN manages to move below its 50 SMA, we could see a drop to support in the $51-$50 zone.
This signal was generated by the GMMA 2.0 strategy suite. The GMMA is the composite picture of 12 different moving averages and displays powerful views of trends. The expansion and contraction of the averages provides direction as to what stage a trend is in as well as the trade-ability of the trend. The Guppy Multiple Moving Average indicator is designed to distinguish the behavior of individual traders vs. institutional investors. This difference in behavior is independent from the price behavior, but it is derived from price behavior. The structure of the GMMA shows the fractal behavior in the market and the way that fractals tend to repeat. The GMMA analysis relies on the relationships between each group of Moving Averages. Compression shows agreement while expansion shows disagreement. When the long term group is widely separated it shows strong investor commitment to the trend. When the two groups of averages are consistently separated it shows trend consistency because traders are not prepared to let prices retreat too far before they become buyers again. It’s a great piece of work and if you’re curious to know more, check out its literature here. Next up, M.
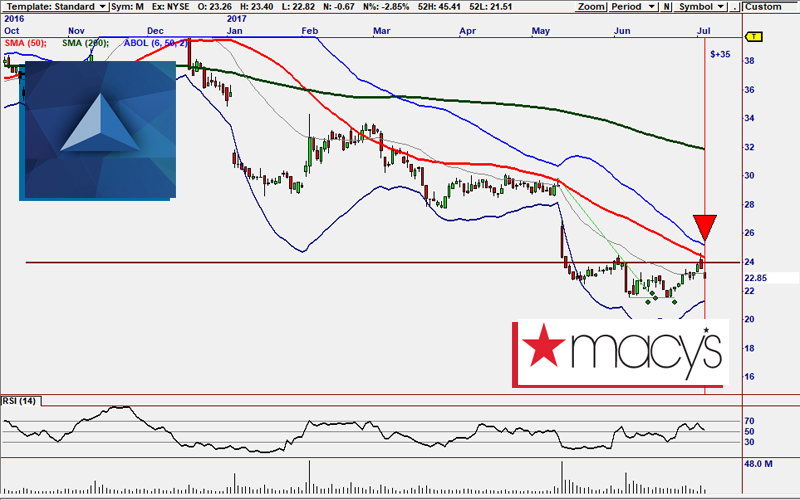
M has set up a new lower high and appears set to move lower.
Macy’s dropped like a rock today, shedding almost 3% during today’s session. It reversed sharply off of resistance at $24 which also happened to be the 50 SMA. It is overbought and at a natural pullback point. This chart is also the classic short reversal setup. It is also sporting a bearish gap pattern, which occurs when a sharp influx in volume suddenly shifts a stock price as a mass amount of orders are filled or closed in a short amount of time. In this case, we may see M continue to drop to $22 before pumping the breaks. Keep an eye out for lower highs along the way.
This signal was fired by the CPS5 Gaps strategy which is part of our CPRM6 Strategy Suite. The Chart Pattern Recognition Module (CPRM) automatically finds the stocks with the strongest patternst. In CPRM6, we can also find the best patterns in all timeframes. CPRM6 provides the flexibility of getting pattern confirmation in either higher timeframes or lower timeframes or both! Whether you enable a higher timeframe or a lower timeframe, CPRM6 will analyze all of the enabled timeframes in your Profile and show you any present and recent patterns.
The CPRM6 EOD Profile looks at the Daily chart and the Weekly chart in order determine which trades have the highest profit potential. Finding patterns in the same direction gives us an incredibly highly confirmed trade. CPRM 6 is one of our most widely used plug-ins and has been for years. To learn more about CPRM, take a look at it here.
To wrap up the day, let’s take a gander at T.
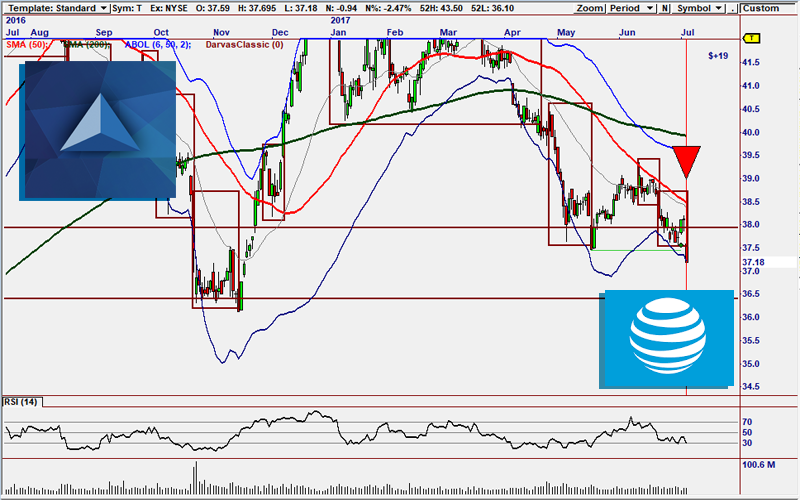
T has broken through support and may be picking up some bearish steam.
Another stock that took a straight punch to the face today was AT&T. And when I mean punch, I mean to the tune of almost 2.5% It has broken through support at $37.50 and it is gaining steam. If things continue to roll downhill for T, we could see it fall as low as $36.50 before hitting the breaks.
This signal is provided by the Darvas Box plug-in. The strategy is based on Nicolas Darvas’ work, which has been used successfully for decades by vast amounts of traders. What the Darvas Box is looking for are increases and decreases in momentum. The Darvas strategies use market momentum to enter and exit trades. If a stock’s price breaks out of a Darvas Box or reverses off of a Darvas resistance level it is a considered a solid short candidate. As we see, AAPL is about to break out of a Darvas Bow to the downside. You can find the Darvas Box Suite here.
That’s all for tonight. We’ll see you back to wrap up the week!

The products and demonstrations listed on this website are not recommendations to buy or sell, but rather guidelines to interpreting their respective analysis methods. This information should only be used by investors who are aware of the risks inherent in trading. Nirvana Systems shall have no liability for any investment decisions based on the use of their software, any trading strategies or any information provided through other services such as seminars, webinars, or content included in the SignalWatch website.