- You are here:
- Home »
- Today's Trades »
- Signals of the Day

Signals of the Day
After focusing on three bearish signals last post, today we are coming at you with three new long signals. Today’s signals are on A, MCHP and PEP. So let’s jump to it.
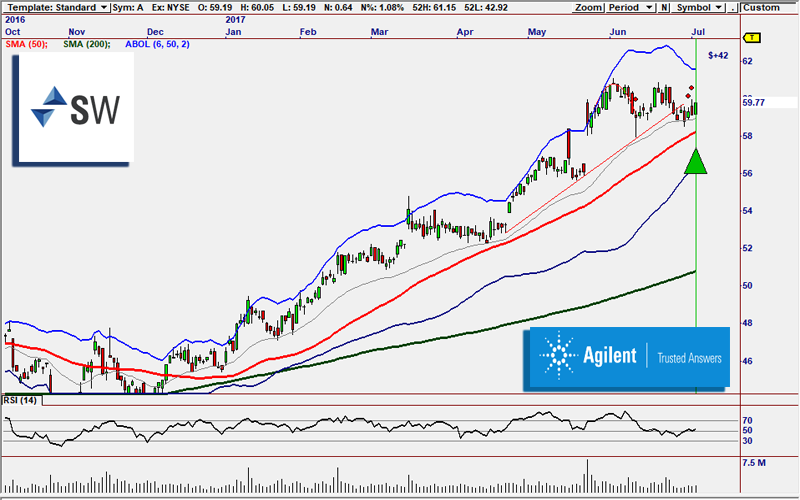
The Secret Sauce is a big fan of A.
SS Heiken Ashi 2
A has been trending nicely for months and is now and it has formed a new entry opportunity in the form of a higher low. It is just above the 50 SMA and it is close to being oversold. Volume is also increasing. Put those three things together and we’ve got a nice setup.
The strategy that found this signal is called the SS Heiken Ashi 2, which is part of the Secret Sauce 2.0 plug-in. This is the sequel to SS 1, which arrived in 2014, exclusively for VisualTrader. The Secret Sauce is all about Relative Momentum. This plug-in identifies symbols that are outpacing the market, as well as those that are lagging behind. By measuring internal forces, we can discover which symbols are being accumulated, and which are being sold off. By knowing a stocks Relative Momentum, we can discern where and when stocks have become overbought and oversold, which leads to great entries and exits, thus, huge profit potential. To learn more check out the SS’s literature here.
If you are looking for more information on any of our strategies or strategy suites, they can be found over in our store over at NirvanaSystems.com, or just click here.
Next up, MCHP.
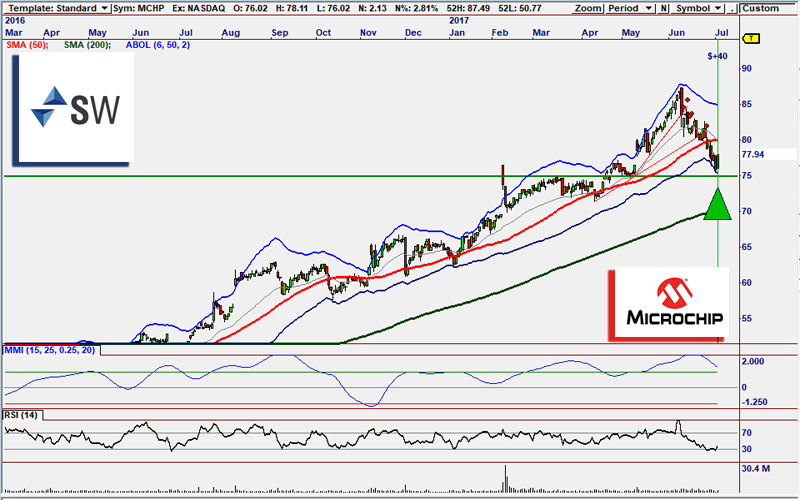
ACT is sniffing out a new buying cycle on MCHP.
MCHP enjoyed a strong run for the entire yea before undergoing a month’s long pullback. In the course of the pullback, it has become extremely oversold and has moved below the 50 SMA, which puts it in prime reversion territory. It is also testing support at $75 which last served as support back in May. It should be noted that when it did act as support, quite a large move followed after a support test. If this move materializes, look for a pop into the $85 zone.
The strategy that generated this signal is the ACT EOD. This strategy makes up part of the Advanced Cycle Trader 2.0 plug-in. ACT 2.0 is all about finding market cycles, If one can identify a cycle and its low, one could profit by buying at cycle lows and selling at highs. Pretty straight forward. ACT 2.0 is so good at finding these new cycles because it uses Digital Signal Processing (DSP) techniques to accurately identify cycle lows. DSP allows ACT 2.0 has more responsive indicators and systems that are more accurate and less prone to whipsaw moves. ACT even filters which cycles are the strongest and how stable they are. To learn more about ACT 2.0, you can check out its literature here!
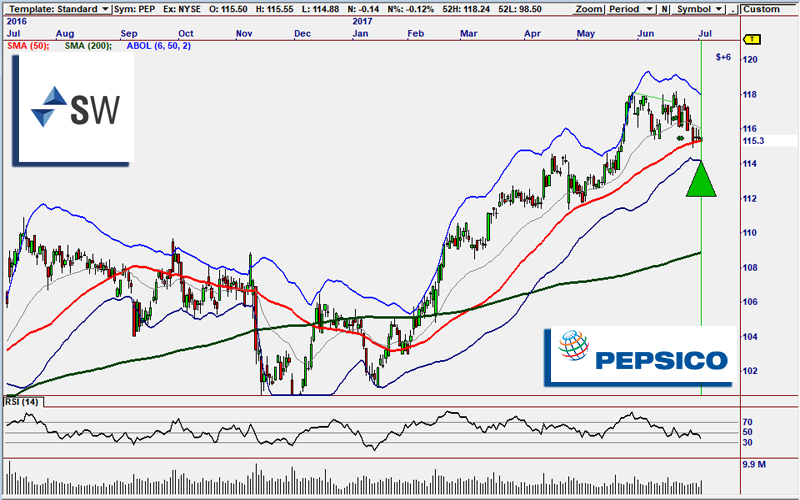
The GMMA is looking for a reversion move on PEP.
Last but not least, Pepsico. We have featured Pepsico several times in the last few months, both times with Darvas signals. This go around however, we are being treated to a new GMMA signal on PEP. PEP has pulled back from resistance close to $118 and has meandered its way down to test the 50 SMA close to $115.30. It has had very little price movement over the last few sessions, so some buying energy could be becoming pent up, which could lead to an explosive move. Volume is also on the rise, pointing to a new potential round of bullishness. If this reversion move kicks back into gear, we could be looking at a pop back into the $118 zone in a hurry.
This signal is brought to you by the GMMA 2.0 trading module. The GMMA is the composite picture of 12 different Moving Averages and provides powerful views of trends. The expansion and contraction of the averages provide direction as to what stage a trend is in as well as the stability of the trend. The Guppy Multiple Moving Average indicator is designed to distinguish the behavior of individual traders vs. institutional investors. This difference in behavior is independent from the price behavior, but it is derived from price behavior. The structure of the GMMA shows the fractal behavior in the market and the way that fractals tend to repeat. The GMMA analysis relies on the relationships between each group of Moving Averages. Compression shows agreement while expansion shows disagreement. When the long term group is widely separated it shows strong investor commitment to the trend. When the two groups of averages are consistently separated it shows trend consistency because traders are not prepared to let prices retreat too far before they become buyers again. It’s a great piece of work and if you’re curious to know more, check out its literature here.
By for now, we’ll see you next time.
Did You Know?
That just for being a SignalWatch Member, you get to try OmniTrader for free?
Absolutely 100%, 30 days on the house.
The products and demonstrations listed on this website are not recommendations to buy or sell, but rather guidelines to interpreting their respective analysis methods. This information should only be used by investors who are aware of the risks inherent in trading. Nirvana Systems shall have no liability for any investment decisions based on the use of their software, any trading strategies or any information provided through other services such as seminars, webinars, or content included in the SignalWatch website.