- You are here:
- Home »
- Today's Trades »
- Signals of the Day – June 19th

Signals of the Day – June 19th
Monday, 6.19.17
Well, that tech slip up didn’t last very long, now did it? The tech stocks roared back to life today, causing a flurry of bullish reversion signals to fire and the market rode tech’s momentum to have all the indexes close in positive territory. The Dow finished up .68%, the S&P +.83% and the Nasdaq closed with the biggest gain, clocking in with a 1.42% gain.
Let’s go ahead and jump into tonight’s signals.
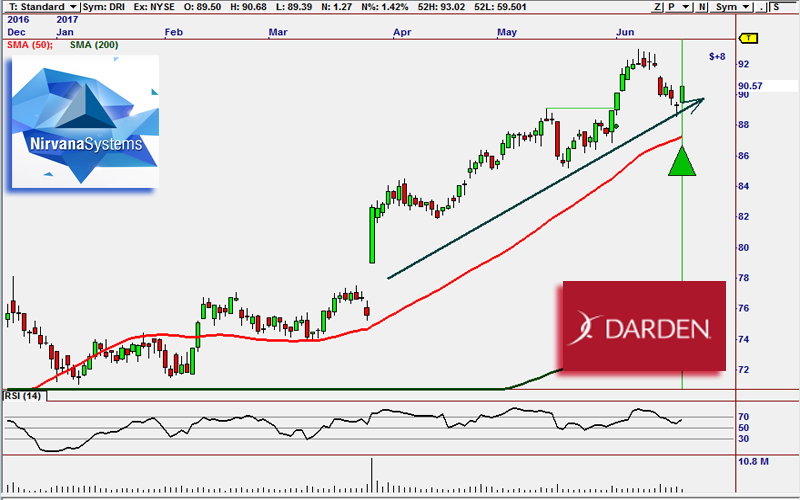
DRI is pivoting off of a beautiful higher low and looks primed to resume its trend.
DRI has been on a heck of a run for months now and it is now poised to make another bullish move. A new higher low has formed along its trend and it is trading well above its major moving averages, which firmly establishes DRI in a bullish mode. This trend has been long and steady, and generally speaking, the longer a trend runs, the more likely its pullbacks will form reliable higher lows. As the old saying goes, “the trend is you friend”, and this setup on DRI looks as friendly as the ice-cream man on a hot summer day.
This signals was produced by the Intrinsic Trend Trading Module. Intrinsic Trend is based ob the concept that is by using a close examination of recent moves in the market, we can see clear indications of emerging trends and channels within those trends where price will probably move as the trend materializes. The idea is to enter trades on pull-backs within the channel that have been identified. We developed several indicators that measure Trend Strength and Trend Quality. These indicators are designed to keep us from prematurely entering trades and missing trades in smooth trends.
Next up, let’s join the tech train and take a look at Microsoft.
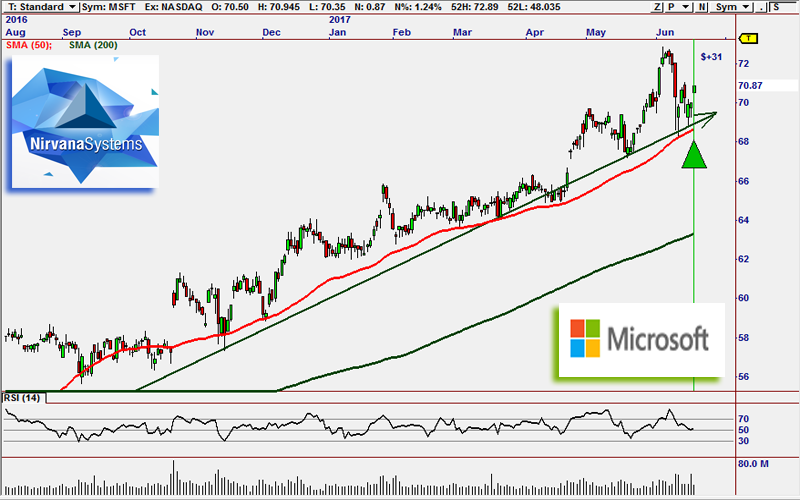
CPRM 6 loves MSFT for a continued reversion move.
So the tech sector absolutely went friggin’ nuts today, making up for a big slip last week. MSFT enjoyed the ride today and finished up 1.24% for the day. As we can see, it used its higher low along support to slingshot back to the upside, executing a beautiful snapback trade. This move was achieved mostly in the opening gap, hence the gap chart pattern. MSFT is well above its major moving averages and is right around the 50 reading on the RSI which tells us that it has some room to go before becoming overbought. If things continue to move this way, we could see it back in the $72 range in the next few sessions.
This signal was fired off by the CPS5 strategy which is a piece of the CPRM6 module. The Chart Pattern Recognition Module (CPRM finds the stocks with the strongest patterns in the market. CPRM6 also allows you to get pattern confirmation in either higher timeframes or lower timeframes – or both combined. CPRM6 will analyze all of the enabled timeframes in your profile and show you any recent patterns. For more info, check out CPRM6’s product page here.
Last but not least, MRK.
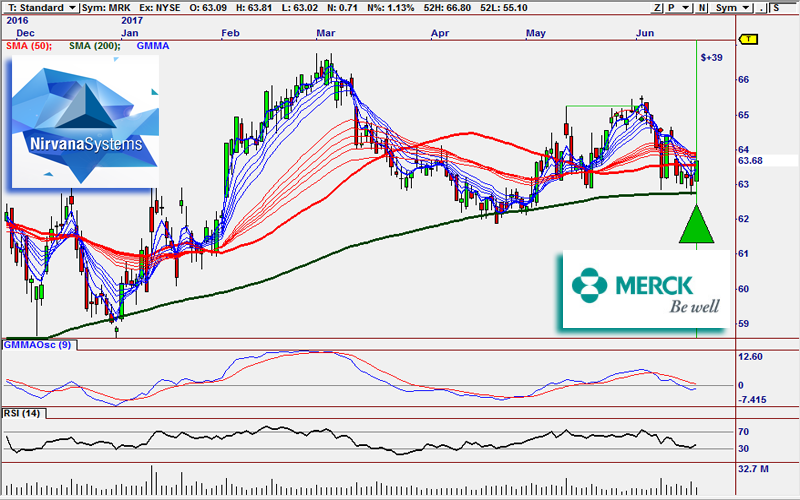
The GMMA strategy likes what it sees on MRK.
MRK has pulled back to support close to $63, which coincided with the 200 SMA, and reacted very bullishly, pivoting to the upside and gaining 1.13% during today’s session. During the process of its nice move, it also moved right on through the 50 SMA with ease. It is still oversold on the RSI and the Bollinger Band indicators, which puts it firmly in promising entry territory for a reversion to mean move. If this move continues higher, we could see it rebound back into the $65 zone.
This signal is brought to you by the GMMA 2.0 trading module. The GMMA is the composite picture of 12 different Moving Averages and provides powerful views of trends. The expansion and contraction of the averages provide direction as to what stage a trend is in as well as the stability of the trend. The Guppy Multiple Moving Average indicator is designed to distinguish the behavior of individual traders vs. institutional investors. This difference in behavior is independent from the price behavior, but it is derived from price behavior. The structure of the GMMA shows the fractal behavior in the market and the way that fractals tend to repeat. The GMMA analysis relies on the relationships between each group of Moving Averages. Compression shows agreement while expansion shows disagreement. When the long term group is widely separated it shows strong investor commitment to the trend. When the two groups of averages are consistently separated it shows trend consistency because traders are not prepared to let prices retreat too far before they become buyers again. It’s a great piece of work and if you’re curious to know more, check out its literature here.
Have a wonderful night and we’ll catch you back here tomorrow.

The products and demonstrations listed on this website are not recommendations to buy or sell, but rather guidelines to interpreting their respective analysis methods. This information should only be used by investors who are aware of the risks inherent in trading. Nirvana Systems shall have no liability for any investment decisions based on the use of their software, any trading strategies or any information provided through other services such as seminars, webinars, or content included in the SignalWatch website.
About the Author Ryan Belknap
Ryan has been with Nirvana since 2012 and has been manning the trading desk since Day 1. He was one of the founding members of Nirvana's Trading Lab and also TraderSource.com along with Ryan Olson and Russell Casperson. Ryan logged more than 3,500 hours trading and educating live in the Lab. He is also the lead author of SignalWatch.com. Ryan is a seasoned educator and has conducted numerous educational webinars and is an OmniTrader University instructor. Ryan prefers swing trading and position trading. Outside of the market, Ryan has passions for the outdoors, baseball, exercise, coffee, pop-culture and spending time with his family.