- You are here:
- Home »
- Today's Trades »
- Signal of the Day – July 10th

Signal of the Day – July 10th
Welcome!
Hello all and happy Monday. The indexes got off to a lukewarm start this week, closing mixed this afternoon. The S&P finished +.09%, the Dow 30 -.03% while the Nasdaq outpaced the others finishing +.38%. Crude jumped the most today, gaining .72% by the close of the session. As for our signals, we are back to three new buy signals this evening on V, JNPR and VTR.
Try it on the House!
Try OmniTrader 2017 on us for 30 days with absolutely no obligation. You’ll be glad you did.
First up JNPR.
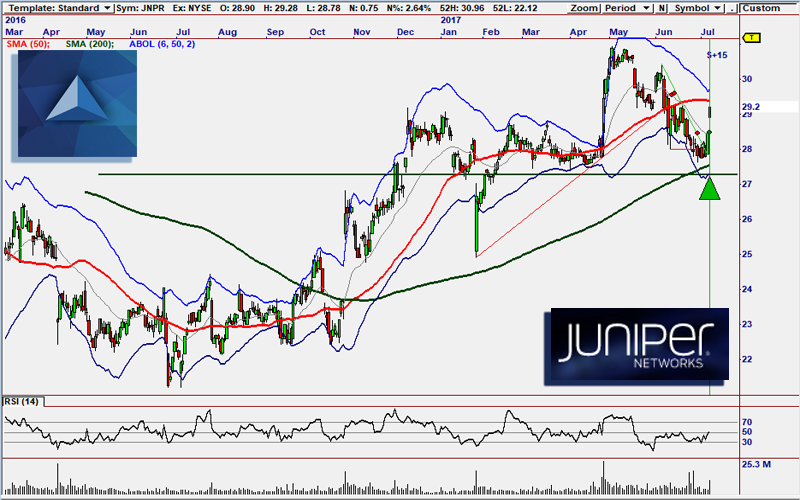
JNPR is executing a great support reversal move.
JNPR has been in a decline since its sharp upturn late last Spring, but after testing support at $27.50 and the 200 SMA, it has been in full on reversal mode. It gapped up 2.64% during today’s session and volume is popping. It is closing in on the 50 SMA, which is also resistance, so we will more than likely see a new pullback that will produce a new higher low. Even if this move pile-drives on by resistance, it looks like this is the beginning of a healthy reversion move. If it continues in this manner, we could see it back in the $30-$31 zone before long.
This signal is brought to you by the Darvas Classic Strategy which is part of our ever-popular Darvas Box Suite. These strategies are riffed off of Nicolas Darvas’ work, the Darvas Box Theory, which has been used masterfully by traders for years to produce consistent profits. What the Darvas Box is looking for are simply increases and decreases in momentum. The Darvas strategies use market momentum to enter and exit trades. If a stock’s price breaks out of a Darvas Box or reverses off of a Darvas resistance level it is a considered a solid short candidate. You can find the Darvas Box Suite here.
Next up, VTR.
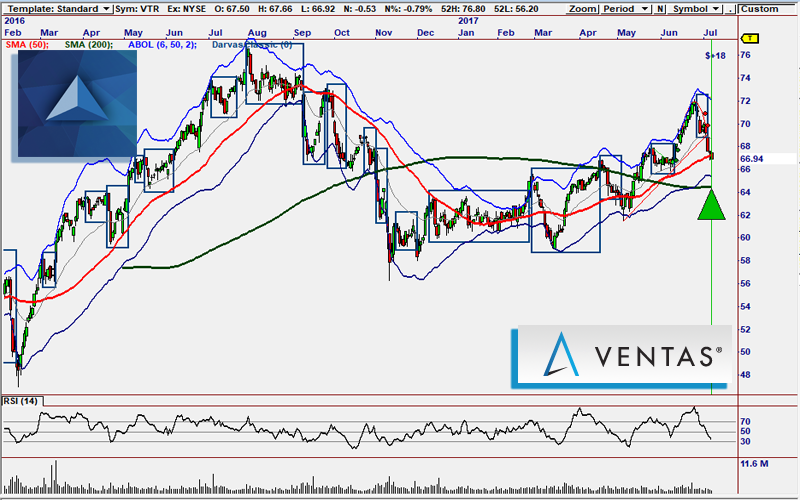
A new higher low could be forming along the 50 SMA.
VTR has been retreating for several sessions but it has now reached a very interesting level, along the 50 SMA which is acting as support at $67.00. It is now oversold on both the classic RSI and Bollinger Band indicators, putting it in ideal reversion territory. If we see a push in volume, that could trigger a great snapback move that could sling-shot VTR back into the low $70’s.
This signal is also a Darvas Box signal. To read more about the Darvas signal, look back to JNPR.
For the last signal of the night, we have a Guppy signal on Visa.
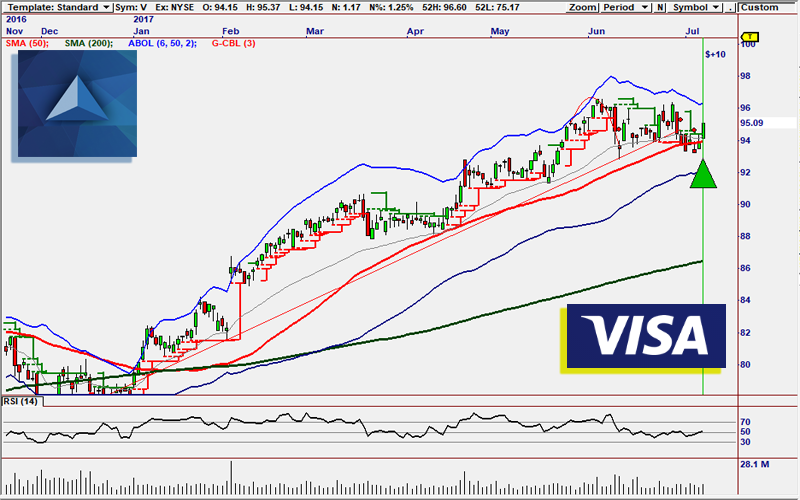
V has formed a new higher low along the 50 SMA.
V has been in a fantastic trend since the first quarter and it is now setting up for the next leg of the trend. It has formed a higher low along the 50 SMA and is responding to it very positively by jumping 1.25%. Volume is on the rise and if things continue to move in this direction, we could be looking at V trending into new high territory.
This signal was generated by the GMMA 2.0 strategy suite. The GMMA is the composite picture of 12 different moving averages and displays powerful views of trends. The expansion and contraction of the averages provides direction as to what stage a trend is in as well as the trade-ability of the trend. The Guppy Multiple Moving Average indicator is designed to distinguish the behavior of individual traders vs. institutional investors. This difference in behavior is independent from the price behavior, but it is derived from price behavior. The structure of the GMMA shows the fractal behavior in the market and the way that fractals tend to repeat. The GMMA analysis relies on the relationships between each group of Moving Averages. Compression shows agreement while expansion shows disagreement. When the long term group is widely separated it shows strong investor commitment to the trend. When the two groups of averages are consistently separated it shows trend consistency because traders are not prepared to let prices retreat too far before they become buyers again. It’s a great piece of work and if you’re curious to know more, check out its literature here.
That’s all for this evening. We’ll see you all right back here tomorrow afternoon. Happy trading!
The products and demonstrations listed on this website are not recommendations to buy or sell, but rather guidelines to interpreting their respective analysis methods. This information should only be used by investors who are aware of the risks inherent in trading. Nirvana Systems shall have no liability for any investment decisions based on the use of their software, any trading strategies or any information provided through other services such as seminars, webinars, or content included in the SignalWatch website.