- You are here:
- Home »
- Today's Trades »
- Signals of the Day – June 8th

Signals of the Day – June 8th
SignalWatch
It was an interesting day in U.S. history as former FBI head James Comey testified in a dramatic fashion against the Trump Administration in an open session with the Senate and then later with a closed-doors session as well. Folks were leery of the affects the market might see, but the Dow actually hit record highs during the testimony. Since the market shrugged off the event, we are going to go with the flow of the market mode and stick with three buy signals this morning. So lets dive on in to our trading signals on SPLS, JNPR and WY.
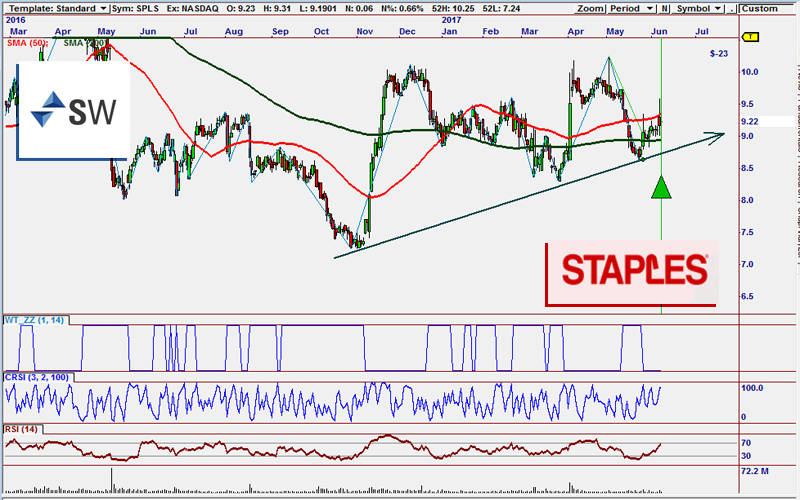
WaveTrader is looking for the next bullish wave on SPLS.
Over the last seven months, STPLS has been forming these fantastic reversion setups, similar to the one we are seeing form now. It is pivoting off of support which is also the pivot point on the bullish trend, it has moved through both the 200 and 50 SMA’s and the WaveTrader ZigZag indicator is providing additional confirmation. SPLS also recently broke through a short-term bearish trend line. All things considered, this look like one great setup for a reversion move.
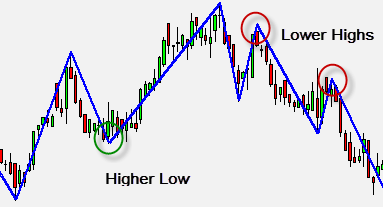
WT3 is all about finding the pivots.
The signal that we see here was fired by WaveTrader 3. WaveTrader is all about finding Higher Lows & Lower Highs. Often times markets naturally sell into weakness on a Lower High, and buy into strength on a Higher Low. When you’re looking to buy you do so on pull-backs at a Higher Low and during corrections, we want to Short the first Lower High. Simple right?
As we all know it is difficult to find those pivots on the right side of the chart! To make it easier for you, we found a way to predict pivots so you see them form on the right edge. We call these WavePivots. WaveTrader is designed specifically to find these Higher Lows and Lower Highs. WaveTrader also manages risk extremely well. When WaveTrader Strategies enter a trade at a Higher Low or Lower High pivot, they place a Stop just below (or above) the turn. These Stops will be very tight relative to the distance the chart can cover – making the Reward:Risk ratios extremely high. If WT3 gets this signal right, and things look good, we could see SPLS back in the $10 zone before long.
To see more check this out .
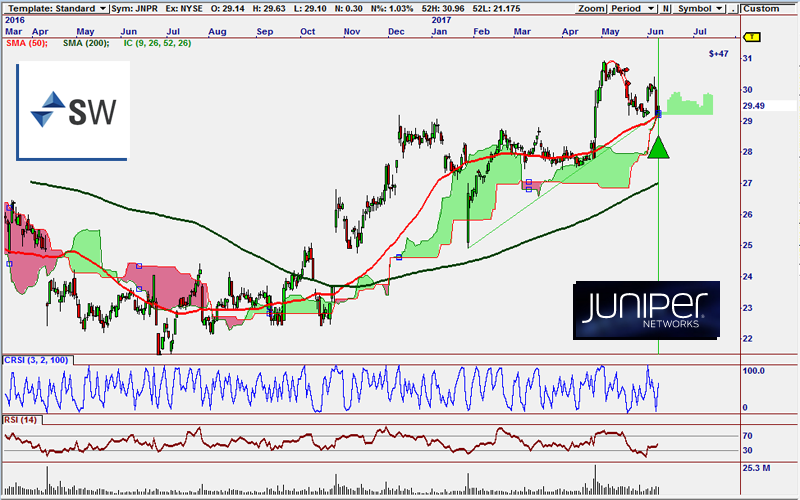
ICM is hot on JNPR.
Check out the higher low on JNPR! It has been trending higher for months and has provided multiple pullbacks. It is now testing support and the 50 SMA and is pivoting off of those levels. Volume is also on the rise and it is oversold on both the RSI and the CRSI, putting it in prime buying opportunity. It is also looking prime on the Ichimoku Cloud indicator.
This signal is found in the Ichimoku Cloud Module. Ichimoku (Ichimoku Kinko Hyo) translates to “one glance equilibrium charts”. What that means is that a “cloud” is formed as a shaded area between support and resistance of the Ichimoku indicators. ICM makes it easy to see trend direction and strength, future support and resistance levels as well as price momentum.
The Ichimoku takes recent price data and plots two main indicators (Leading Span A and Leading Span B) to create a “cloud”. The cloud is then shifted to the right. If price is on either side of the cloud, we can determine what type of trend we are in. The thickness of the cloud tells us the trend’s strength. As price approaches the cloud, we will often see the cloud provide support or resistance. If ICM is right on JNPR, we could be looking at a near term move into the $31 zone.
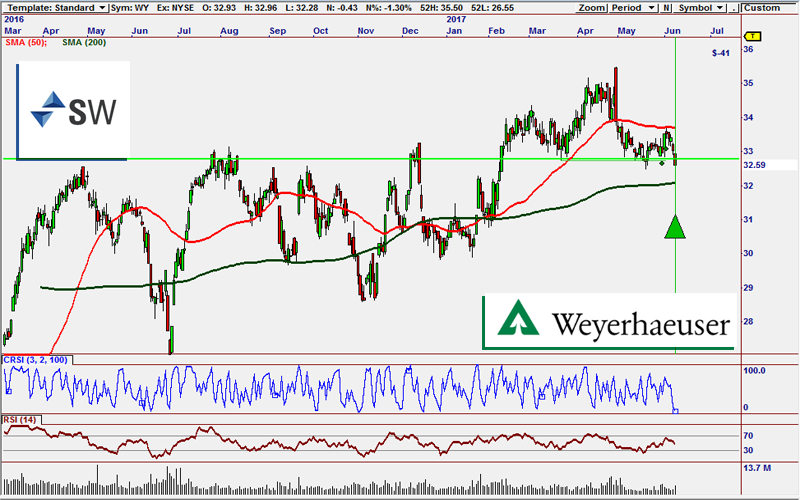
A new reversal move may be ready to roll on WY.
The signal you see here on WY was fired by MS-16, one of our advanced strategies. MS-16 works by using two different momentum based systems and filters based on trend direction. MS-16 also uses an indicator called Days to Earnings which helps traders avoid trading into earnings reports, offering a extra layer of safety. MS-16 also uses a scan which pinpoints the stocks that are outperforming the current market that have also made a significant pullback against the trend. This leads us to great reversion opportunities like we see here in WY.
WY is testing resistance close to $33, it is right in the middle between two major moving averages and it is oversold on the CRSI. Volume is also starting to pop and all of these factors tied together make for a compelling case that we will see a reversion move. If MS-16 is right on, we could see WY back in the $34 zone in a jiffy.
That’s all for tonight. If you’re new here to the Nirvana community and you have not taken us up on the 30 Day Risk-Free trial, now is a great time because there are some awesome things coming up right down the road. Check it out!

The products and demonstrations listed on this website are not recommendations to buy or sell, but rather guidelines to interpreting their respective analysis methods. This information should only be used by investors who are aware of the risks inherent in trading. Nirvana Systems shall have no liability for any investment decisions based on the use of their software, any trading strategies or any information provided through other services such as seminars, webinars, or content included in the SignalWatch website.
About the Author Ryan Belknap
Ryan has been with Nirvana since 2012 and has been manning the trading desk since Day 1. He was one of the founding members of Nirvana's Trading Lab and also TraderSource.com along with Ryan Olson and Russell Casperson. Ryan logged more than 3,500 hours trading and educating live in the Lab. He is also the lead author of SignalWatch.com. Ryan is a seasoned educator and has conducted numerous educational webinars and is an OmniTrader University instructor. Ryan prefers swing trading and position trading. Outside of the market, Ryan has passions for the outdoors, baseball, exercise, coffee, pop-culture and spending time with his family.