- You are here:
- Home »
- Today's Trades »
- Signals of the Day – June 12th

Signals of the Day – June 12th
Good afternoon everyone and welcome back! I hope all of you had a fantastic weekend and had a great start to your week’s as well. The indexes started off the week on shaky ground, with all of the major indexes slipping just a touch. The Dow dropped -.17, the S&P -.10 , and the Nasdaq -.52%. This move to the downside was aided largely by the move down in the tech sector but is not too alarming though, seeing as we saw recent highs last week, during some political drama no less. Seeing pullbacks is not unusual after achieving new highs, so nothing to sweat. In that light, we are going to jump into a few new buy signals this evening. So without further ado, let’s get to it.
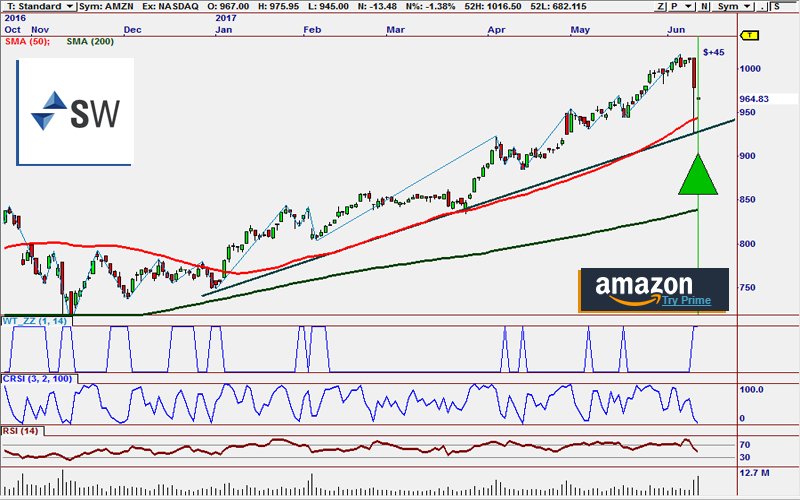
ACT EOD is looking for a reversion to mean move on AMZN after its big dip today.
Our first signal of the day is on the mighty Amazon.com. As we can see in the chart, AMZN has had two tough sessions in a row, dropping fro m over $1000 all the way down to $950 at one point to the test the 50 SMA. It has rebounded a bit from Friday’s lows but it lost an additional 1.38% during today’s session. While this decline has caused some to look cockeyed at AMZN, this is a classic reversion to mean setup.
Reversion to mean setups are widely used by millions of traders and investors. The M in RTM is the mean, which is an average based on the closing price of a stock over a certain period of time, most commonly the 50 and 200 period Simple Moving Averages (SMA’s). Those averages generally show us the overall value of a company. But smaller issues can cause price fluctuations in time periods smaller than those which create moves away from the average. But historically, we tend to see stock’s revert back to their means. That’s why many trader’s mouths start to water when they see strong trending stocks start to pullback. They are counting on the reversion move, which they can profit nicely from. The moving averages on AMZN are obviously hugely bullish and we are looking for a move back to the upside.
This signal was fired by the ACT EOD strategy which can be found in the ACT 2.0 plug-in. ACT 2.0 is based on technology called Digital Signal Processing, or DSP. ACT uses DSP to process market data and find new trading cycles. ACT uses DSP Powered indicators starting with Market Mode Indicator (MMI), which identifies the personality, or mode, of the market. The MMI determines when a market is in a cycle or trending. Once the market mode is identified, we can look for good cycle trades following along with the mode. ACT shows you both short and long term cycles. The Spectrum Indicator shows you the strength and stability of the strongest market cycle, and ACT’s Heatmap shows a overall view of the market cycles that are currently in play. ACT also uses an OptiSmooth Filter which reduces the lag that is inherent in most other smoothing indicators. If AMZN follows along with ACT, we could see a short term move back into the high $990’s or even a $1,000.
Next up, MA.
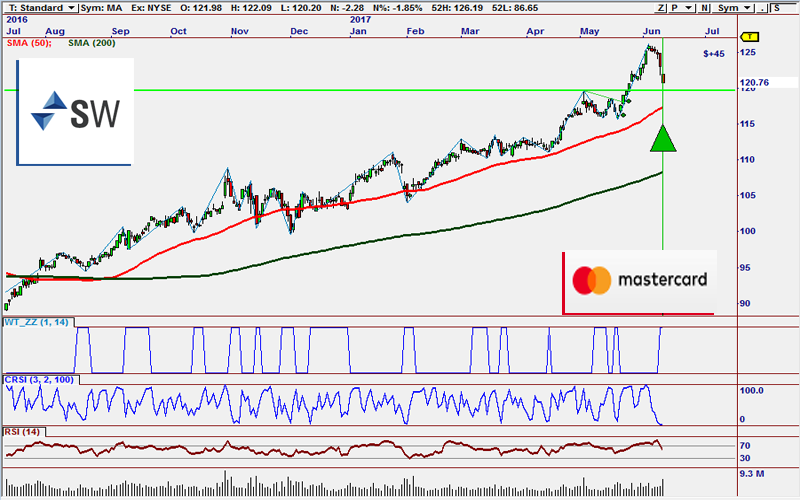
We are looking at a new higher low on MA.
MA has been trucking higher for months now and last month it enjoyed an even larger amount of success than previous months. This month however, we have seen MA pull back and it is now showing signs of halting its decline and forming a higher low. It is closing in on support at $120 and volume is starting to hop. We also see that is oversold on the CRSI, or Connors RSI which specializes on finding reversion moves that last for 3-5 days. It is trading well above its major moving averages putting it squarely in a bullish market mode.
This signal was fired by MS-16, one of our newer, more advanced strategies. MS-16 works by using two different momentum based systems and filters based on trend. MS-16 also uses an indicator called Days to Earnings which helps traders avoid trading into earnings reports, offering a extra layer of safety. MS-16 scans for stocks that are outperforming the current market but have also undergone significant pullbacks against its prevailing trend. This leads us to great reversion opportunities like we see here in MA. If this reversion move does follow through for us, we could see MA bounce back into the $125 zone.
To round out the evening, let’s look at MSFT.
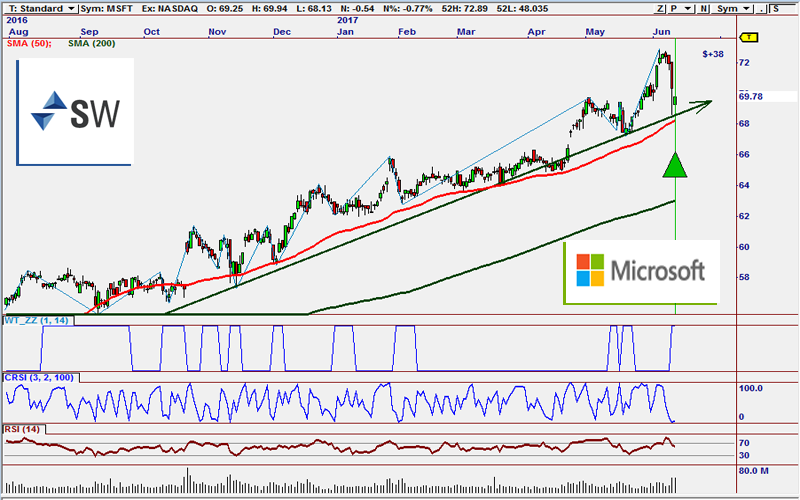
The Guppy CBL Classic Strategy is looking for a bullish reversion move on MSFT.
Microsoft is another tech stock that has taken a whooping over the past couple of days but it has started to rebound off of support and form a great higher low opportunity at $69.50 which isn’t too far away from the 50 SMA. It has been trending higher for months and is overwhelmingly bullish. Volume is also starting to increase exponentially which could indicate that the bulls are back to protect their positions, or even add to those positions, which will of course push the stock higher. If this moves follows through and we see the reversion move come to fruition, we could see MSFT back in the $70-$72 zone in a hurry.
The signal we see here on AMZN is brought to us by our GMMA 2.0 strategy suite. This plug-in is based on the very popular trading method developed by Daryl Guppy, the Count Back Line. The Count Back Line System uses a precise method for triggering entries, and is used for both Real Time and End-of-Day trading. The concept is based on “counting back” from an established low or pivot to establish an entry level. After the pivot has been identified, the system counts back 3 highs (for Longs) or 3 lows (for Shorts) to identify the level at which an entry will be triggered. An entry is signaled when price closes beyond the CBL, as defined in Guppy’s article on pages. It’s a fantastiv way to identify an entry level for a trade, because it adapts to the volatility of the market.
On another note...
As you all know, SignalWatch is powered by OmniTrader 2017. We have been asked a few times now if folks can use our strategies with other trading platforms. That answer is no. But… if you don’t have your own copy of OmniTrader, you can try it out for free for 30 days just for being a member of SignalWatch. You’ve seen the signals, so what are you waiting for?
That’s it for tonight. We’ll see you back tomorrow for more great trading signals!

The products and demonstrations listed on this website are not recommendations to buy or sell, but rather guidelines to interpreting their respective analysis methods. This information should only be used by investors who are aware of the risks inherent in trading. Nirvana Systems shall have no liability for any investment decisions based on the use of their software, any trading strategies or any information provided through other services such as seminars, webinars, or content included in the SignalWatch website.
About the Author Ryan Belknap
Ryan has been with Nirvana since 2012 and has been manning the trading desk since Day 1. He was one of the founding members of Nirvana's Trading Lab and also TraderSource.com along with Ryan Olson and Russell Casperson. Ryan logged more than 3,500 hours trading and educating live in the Lab. He is also the lead author of SignalWatch.com. Ryan is a seasoned educator and has conducted numerous educational webinars and is an OmniTrader University instructor. Ryan prefers swing trading and position trading. Outside of the market, Ryan has passions for the outdoors, baseball, exercise, coffee, pop-culture and spending time with his family.