- You are here:
- Home »
- Today's Trades »
- SignalWatch – 6.1.17

SignalWatch – 6.1.17
June 1st
The Dow raced into new records today as all of the major indexes closed up for the day. We have a lot to cover this afternoon so let’s get to it and kick things off with Apple.
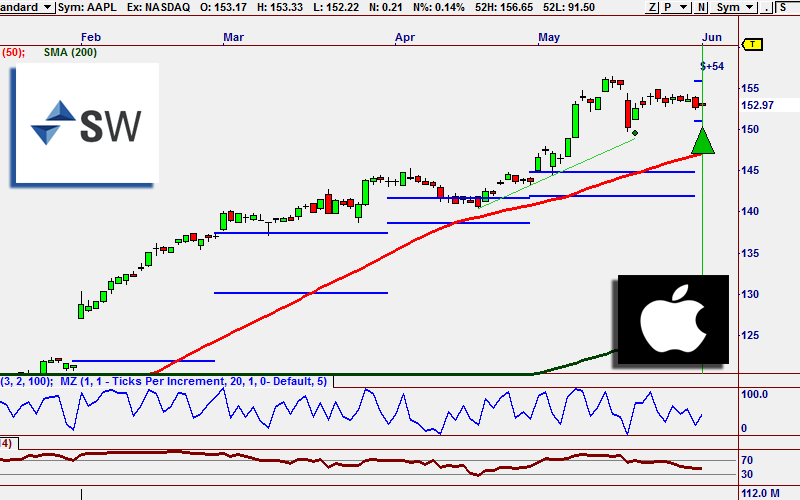
Apple is looking to break out of the Money Zone.
Since we last saw AAPL on SW, it has meandered around a bit, consolidating and price movement has been pretty flat. It has gone up some since its last signal though. Tonight, however, we have another promising buy signal on Apple, this time a MoneyZone signal.
Let’s get the technical stuff out of the way first though. AAPL has been trending higher for quite awhile, and the longer and smoother a trend becomes, the more predictable and easier they are to trade. It has come off of a higher low that developed in the middle of May but price has not moved much, which puts AAPL about half-way up on the RSI as far as being overbought or oversold is concerned. What does that mean? It means that there is still room to run essentially. AAPL is also trading well above it major moving averages and volume has been holding steady. So what is the strategy looking at in AAPL?

To learn more check this out!
The strategy that fired this signal is the Money Zone Reversal EOD strategy which is a piece of the Money Zone 3.0 plug-in. Money Zone is based on Market Profile. Market Profile is used by both Real-Time and End-of-Day traders to identify the most profitable levels in the market. Money Zone is beneficial to traders because it shows the major levels where the market reacts to price. You can see these levels on AAPL, they are the blue horizontal lines. Pro’s use these levels to find both entries and exits. Money Zone provides you with levels based on the most recent price and volume action. These levels can be used visually identify these important levels in any stock.
MZ also looks for confluence levels. Confluence levels form when several Money Zone Levels occur close to the same price. The confluence levels shows that the market is monitoring that price over a longer period of time. These levels can represent support, resistance or other levels that are institutional buying and selling points. When the current price tests on these levels, the reaction is strong and the subsequent move provides outstanding trading opportunities, like we see with AAPL. If AAPL responds in kind to the MZ, we could be looking at a quick move into the high $150’s, possibly even $160.
Next, we have an reversion to mean signal on PH.
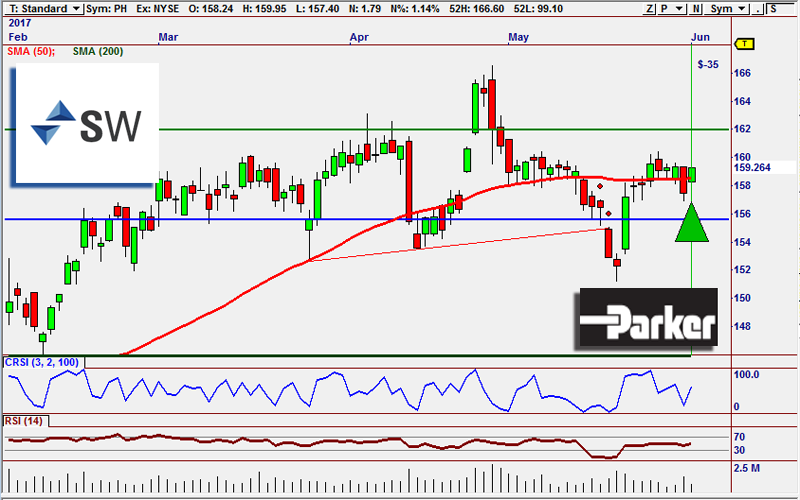
The MS-16 strategy is looking for a reversion move on PH.
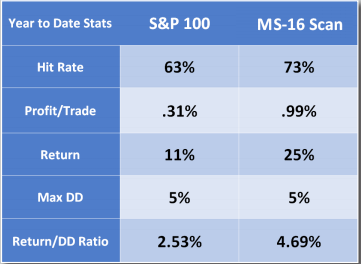
The year-to-date performance of the MS-16 strategy on the stocks in the S&P 100 vs. the dynamically changing stocks in the MS-16 Scan.
Parker Hannifin has been bouncing around a trading range for several months with the lower boundary being close to $155 and the upper boundary hovering close to $161.50. It did make an attempt to break out of the range back in April as PH achieved new highs but that move did ultimately pull back into the trading range. Since then, it has rebounded off of support and is now consolidating along the 50 SMA. So what about a reversion move? We are looking for a reversion back to highs in the $165 zone. If PH can manage to stay above the 50 SMA, it could give the bulls all the confidence they need to produce a new buying cycle and pop PH back into record territory.
This signal was generated by our MS-16 advanced strategy. The strategy works by using two different momentum based systems and filters based on trend direction. MS-16 also uses an indicator called Days to Earnings. This indicator helps traders avoid trading into earnings reports, offering a extra layer of safety. MS-16 also uses a scan which pinpoints the stocks that are outperforming the current market that have also made a significant pullback against the trend. This leads us to great reversion opportunities like we see here in PH.
For the last signal of the evening, we are going to look at yet another MS-16 signal, this time on APD.
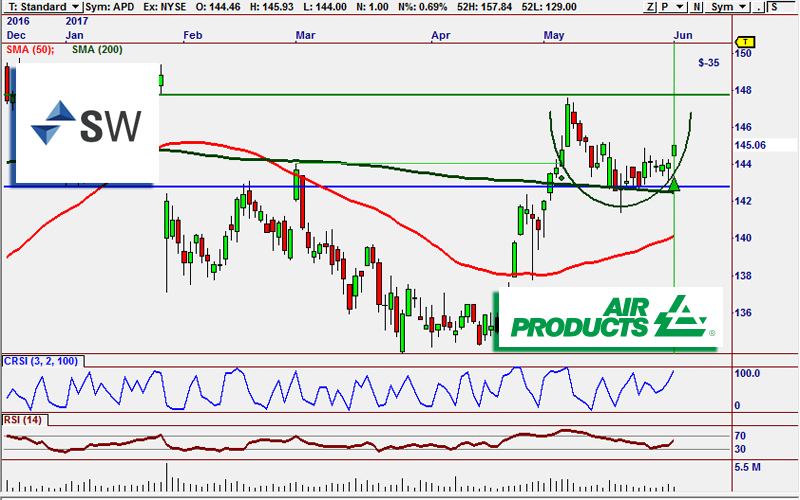
Along with a nice rounded bottom, APD is also sporting an MS-16 signal.
For starters, that is one heck of a saucer pattern that is currently forming. A saucer is a very popular chart pattern that shows when a stock’s price has reached its low and that the downward trend has ended. Usually you also see volume dry up in the valley of the saucer, like you do here, and then volume increase once price starts to move higher, or lower for an inverse. These can lead to big breakout moves once the move through the “lid” of the saucer which in this case is right around $146. APD’s momentum is bullish and it is moving higher off of the RSI, CRSI and Bollinger Band indicators. Like PH, MS-16 is also looking for a reversion to mean move.
Real quick, one request we received was to explain exactly what Reversion to Mean and RTM strategies are looking for. RTM trading is widely used by a variety or traders and investors. The M in RTM is the mean, which is an average based on the closing price of a stock over a certain period of time, most commonly the 50 and 200 period Simple Moving Averages (SMA’s). Those averages generally show us the overall value of a company. But smaller issues can cause price fluctuations in time periods smaller than those which create moves away from the average. But historically, we tend to see stock’s revert back to their means. That’s why many trader’s mouths start to water when they see strong trending stocks start to pullback. They are counting on the reversion move, which they can profit nicely from.
This signal was fired by an RTM strategy, the MS-16. We already went over how that one works, so I won’t bore you with the details once again. Why did I include it twice then? Because its a highly accurate strategy that most often produces excellent signals.
That’s all for tonight. Come on back tomorrow as we round out the week. Have a wonderful night!

The products and demonstrations listed on this website are not recommendations to buy or sell, but rather guidelines to interpreting their respective analysis methods. This information should only be used by investors who are aware of the risks inherent in trading. Nirvana Systems shall have no liability for any investment decisions based on the use of their software, any trading strategies or any information provided through other services such as seminars, webinars, or content included in the SignalWatch website.
About the Author Ryan Belknap
Ryan has been with Nirvana since 2012 and has been manning the trading desk since Day 1. He was one of the founding members of Nirvana's Trading Lab and also TraderSource.com along with Ryan Olson and Russell Casperson. Ryan logged more than 3,500 hours trading and educating live in the Lab. He is also the lead author of SignalWatch.com. Ryan is a seasoned educator and has conducted numerous educational webinars and is an OmniTrader University instructor. Ryan prefers swing trading and position trading. Outside of the market, Ryan has passions for the outdoors, baseball, exercise, coffee, pop-culture and spending time with his family.