- You are here:
- Home »
- Today's Trades »
- SignalWatch – 5.24.17
SignalWatch – 5.24.17
May 24th
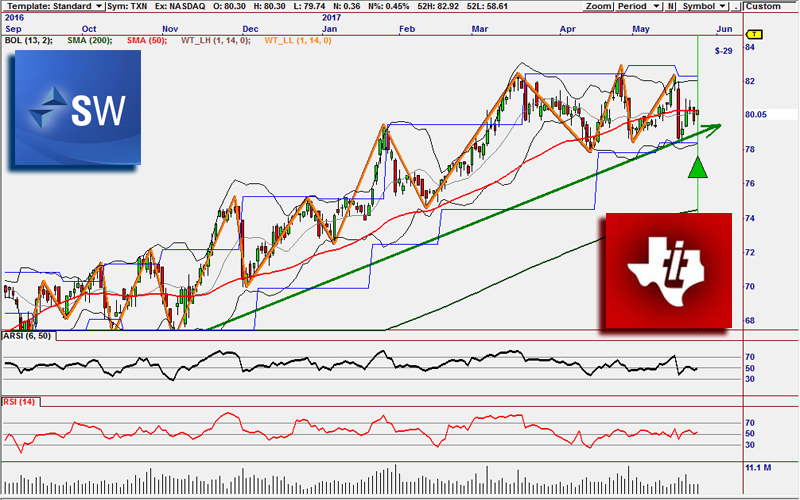
WaveTrader 3 has fired a new buy signal on Texas Instruments.
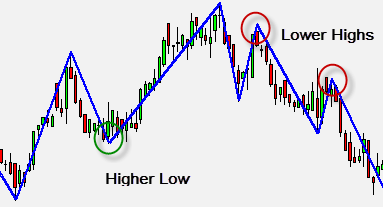
TXN has been moving steadily higher for months, with numerous higher low entries presenting themselves along the way. This is key because in order to successfully trade a trending stock, you must buy the dips. As we can see, a new higher low has just formed off of the trend line several days ago. Since using the trend as a fulcrum, it has tested the 50 SMA for several days. The 50 period simple moving average is an important psychological level that many traders look at very carefully. If a stock’s price can move through the 50 to the upside that is bullish confirmation and bearish confirmation is just the opposite. So, if we see TXN make a move higher and cross the 50, that’s a great piece of confirmation.
Example of higher lows and lower highs.
TXN is also at the halfway point on the RSI indicator which measures a stock’s relative strength. If a stock is at 30 on the RSI, it is considered oversold and in a good spot to buy and if it is at 70 it is overbought and may be ready to pullback. TXN however is at 50, which shows us that it still has some room to go before becoming overbought. Volume is holding steady and if we witness a push in volume, that could be signalling that the next round of buying is underway.
This signal on TXN was fired by our WT3 Long Term strategy which is part of our WaveTrader 3 plug-in. WT3 was made for the swing trading method, which is all about finding higher lows and lower highs and using those as entries. It’s incredibly difficult to find those pivots without undergoing draw downs, which are absolutely zero fun. In order to avoid draw downs, WT3 uses Wave Pivots to fire signals which are vetted by Fractal Wave Theory. A fractal is a repeating pattern that is similar across different scales. By using Fractal Wave Theory, we identify “waves within waves”, taking advantage of the accuracy of small waves while benefiting from the smoothing, or stabilizing, effect of larger waves. This is exactly what we see with Texas Instruments. If WT3 called this one correctly, we could see TXN heading back into the $82-$83 zone before long. If you’d like to know more, check out WaveTrader here.
Next on the agenda, Citi.
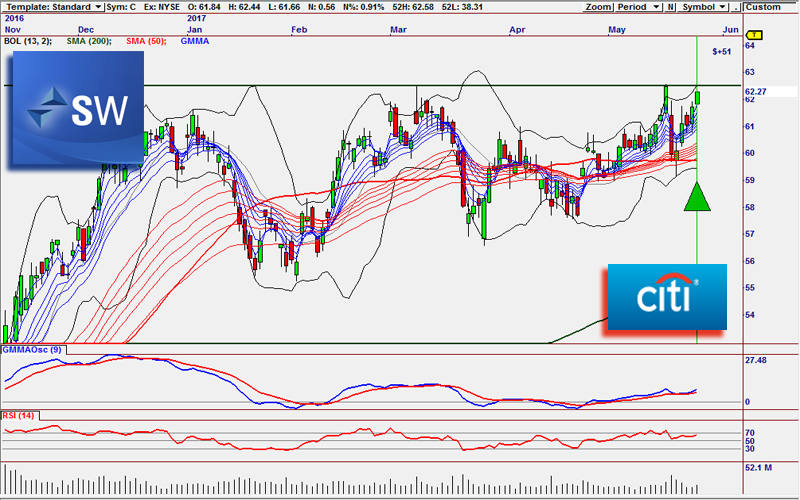
We have a new Guppy signal looking for a breakout move on C.
Signals are based on the CBL concept written by Daryl Guppy.
C has been enjoying a nice run as of late, and now finds itself on the verge of testing resistance at $62.50. C tried and failed to break through this level last week, which then lead to a pullback to the 50 SMA, where we saw a bullish pivot form a higher low. Since C made the pivot off of the 50, it has been nothing but strong. Volume increased today which could be pointing to more buyers getting in which would push C through the resistance level and lead to a buying frenzy causing a breakout move.
The Guppy CBL Classic strategy is to thank for this signal, which can be found in the GMMA 2.0 plug-in. This plug-in and its strategies are based on the excellent work of Daryl Guppy. The GMMA was originally based on his Guppy Multiple Moving Average theory, which many traders use to successfully prospect today. We added in the Count Back Line (CBL) concept to make the signals even better. CBL is closely related to the original GMMA because it changes along with the volatility of the market.
Volatility and changes in volatility drive the market. The faster speeds of trade executions means that the consequences of emotional thinking flows more quickly through the market. Many older measures of volatility simply don’t cut it anymore because they are dependent on time. The CBL adjusts itself on the fly, giving you an idea of changes in volatility before it occurs. If the CBL has called the one correctly, we could see C pop into the mid $60’s before long.
Lastly, we have a sell signal on HAL.
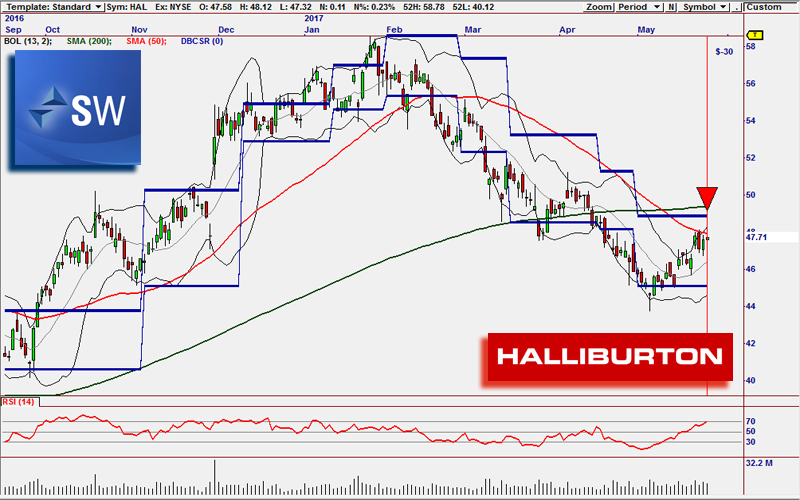
The Darvas Classic strategy is looking for another round of selling on HAL.
HAL has been trending lower for months. It has produced a bounty of lower highs, which as we have discussed, are key entries into successful short trades on bearish trends. We also see that HAL is testing the 50 SMA, which has formed a confluence level with resistance. When you have multiple key indicators meeting at the same levels, they tend to intensify the pivots and moves once a stock tests those prices. One top of that, HAL is also overbought on both the RSI and the Bollinger Band indicators, which gives us further confirmation that this is the the perfect spot on a chart to go short.
This signal was provided by the Darvas Box plug-in. The method driving the strategy was developed by Nicolas Darvas and has been used successfully for decades by millions of traders. What Darvas is looking for is basically increases and decreases in momentum. Darvas uses market momentum to decide when to enter and exit a trade. If a stock’s price breaks out of a Darvas Box, it is a considered a potential entry. And as we can see on HAL, we are looking at a potential bearish move.
If you’d like to see more about all of the strategies featured on SignalWatch you can find them all over on our website, NirvanaSystems.com, or simply click here. And don’t forget, if you haven’t tried OT 2017 yet, you can score a free trial for 30 days just for being SignalWatch subscriber.
Have a wonderful evening and we’ll catch you all tomorrow.

The products and demonstrations listed on this website are not recommendations to buy or sell, but rather guidelines to interpreting their respective analysis methods. This information should only be used by investors who are aware of the risks inherent in trading. Nirvana Systems shall have no liability for any investment decisions based on the use of their software, any trading strategies or any information provided through other services such as seminars, webinars, or content included in the SignalWatch website.
About the Author Ryan Belknap
Ryan has been with Nirvana since 2012 and has been manning the trading desk since Day 1. He was one of the founding members of Nirvana's Trading Lab and also TraderSource.com along with Ryan Olson and Russell Casperson. Ryan logged more than 3,500 hours trading and educating live in the Lab. He is also the lead author of SignalWatch.com. Ryan is a seasoned educator and has conducted numerous educational webinars and is an OmniTrader University instructor. Ryan prefers swing trading and position trading. Outside of the market, Ryan has passions for the outdoors, baseball, exercise, coffee, pop-culture and spending time with his family.